Fishing Down Marine Food Webs
Daniel Pauly,* Villy Christensen, Johanne Dalsgaard, Rainer Froese,
Francisco Torres Jr.
SCIENCE VOL. 279 6 FEBRUARY 1998 www.sciencemag.org
This article was mirrored here faithfully for
ease of access and printing.
www.seafriends.org.nz/issues/fishing/pauly1.htm
D. Pauly and J. Dalsgaard, Fisheries Centre, 2204 Main
Mall, University of British Columbia, Vancouver, British Columbia, Canada
V6T 1Z4.
V. Christensen, R. Froese, F. Torres Jr., International
Center for Living Aquatic Resources Management, M.C. Post Office Box 2631,
0718 Makati, Philippines.
* To whom correspondence should be addressed. E-mail:
pauly@fisheries.com
The mean trophic level of the species groups reported in Food
and Agricultural Organization global fisheries statistics declined from
1950 to 1994. This reflects a gradual transition in landings from long-lived,
high trophic level, piscivorous bottom fish toward short-lived, low trophic
level invertebrates and planktivorous pelagic fish. This effect, also found
to be occurring in inland fisheries, is most pronounced in the Northern
Hemisphere. Fishing down food webs (that is, at lower trophic levels) leads
at first to increasing catches, then to a phase transition associated with
stagnating or declining catches. These results indicate that present exploitation
patterns are unsustainable.
Exploitation of the ocean for fish and ma-rine invertebrates, both wholesome
and valuable products, ought to be a prosperous sector, given that capture
fisheries - in con-trast to agriculture and aquaculture - reap harvests
that did not need to be sown. Yet marine fisheries are in a global crisis,
mainly due to open access policies and subsidy-driven overcapitalization
(1). It may be argued, however, that the global crisis is mainly one of
economics or of governance, whereas the global resource base itself fluctuates
naturally. Contradicting this more optimistic view, we show here that landings
from global fisheries have shifted in the last 45 years from large piscivorous
fishes toward smaller invertebrates and planktivorous fishes, especially
in the Northern Hemi-sphere.
This may imply major changes in the structure of marine food webs.
Two data sets were used. The first has estimates of trophic levels for
220 different species or groups of fish and invertebrates, covering all
statistical categories included in the official Food and Agricultural Organization
(FAO) landings statistics (2). We obtained these estimates from 60 published
mass-balance trophic models that covered all major aquatic ecosystem types
(3, 4).
The models were constructed with the Eco-path software (5) and local
data that included detailed diet compositions (6). In such models, fractional
trophic levels (7) are estimated values, based on the diet compositions
of all ecosystem components rather than assumed values; hence, their precision
and accuracy are much higher than for the integer trophic level values
used in earlier global studies (8). The 220 trophic levels derived from
these 60 Ecopath applications range from a definitional value of 1 for
primary producers and detritus to 4.6 (+/- 0.32) for snappers (family Lutjanidae)
on the shelf of Yucatan, Mexico (9). The second data set we used comprises
FAO global statistics (2) of fisheries landings for the years from 1950
to 1994, which are based on reports submitted annually by FAO member countries
and other states and were recently used for reassessing world fisheries
potential (10). By combining these data sets we could estimate the mean
trophic level of landings, presented here as time series by different groupings
of all FAO statistical areas and for the world (11).
For all marine areas, the trend over the past 45 years has been a decline
in the mean trophic level of the fisheries landings, from slightly more
than 3.3 in the early 1950s to less than 3.1 in 1994 (Fig. 1A). A dip in
the 1960s and early 1970s occurred because of extremely large catches [>12E6
metric tons (t) per year*] of Peruvian anchoveta with a low trophic level
(12) of 2.2 (+/- 0.42).
Since the collapse of the Peruvian anchoveta fishery in 19721973,
the global trend in the trophic level of marine fisheries landings has
been one of steady decline. Fisheries in inland waters exhibit, on the
global level, a similar trend as for the marine areas (Fig. 1B): A clear
decline in average trophic level is apparent from the early 1970s, in parallel
to, and about 0.3 units below, those of marine catches. The previous plateau,
from 1950 to 1975, is due to insufficiently detailed fishery statistics
for the earlier decades (10). |
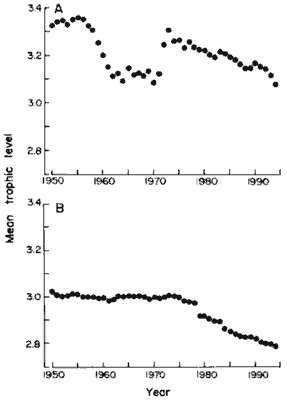
Fig. 1. Global trends of mean trophic level of fisheries
landings, 1950 to 1994. (A) Marine areas; (B) inland areas. |
| In northern temperate areas where the fisheries are most developed,
the mean trophic level of the landings has declined steadily over the last
two decades. In the North Pacific (FAO areas 61 and 67; Fig. 2A), trophic
levels peaked in the early 1970s and have since then decreased rapidly
in spite of the recent increase in landings of Alaska pollock, Theragra
chalcogramma, which has a relatively high trophic level of 3.8 (+/-
0.24). In the Northwest Atlantic (FAO areas 21 and 31; Fig. 2B), the fisheries
were initially dominated by planktivorous menhaden, Brevoortia spp.,
and other small pelagics at low trophic levels. As their landings decreased,
the average trophic level of the fishery initially increased, then in the
1970s it reversed to a steep decline. |
Fig. 2. Trends of mean trophic level of fisheries landings
in northern temperate areas, 1950 to 1994. (A) North Pacific (FAO areas
61 and 67); (B) Northwest and Western Central Atlantic (FAO areas 21 and
31); (C) Northeast Atlantic (FAO area 27); and (D) Mediterranean (FAO area
37). |
Similar declines are apparent throughout the time series for the Northeast
Atlantic (FAO area 27; Fig. 2C) and the Mediterranean (FAO area 37; Fig.
2C), although the latter system operates at altogether lower trophic levels.
The Central Eastern Pacific (FAO area 77; Fig. 3A), Southern and Central
Eastern Atlantic (FAO areas 41, 47, and 34; Fig. 3B), and the Indo-Pacific
(FAO areas 51, 57, and 71; Fig. 3C) show no clear trends over time. In
the southern Atlantic this is probably due to the development of new fisheries,
for example, on the Patagonian shelf, which tends to mask declines of trophic
levels in more developed fisheries.
In the Indo-Pacific area, the apparent stability is certainly due to
inadequacies of the statistics, because numerous accounts exist that document
species shifts similar to those that occurred in northern tem-perate areas
(13).
Fig. 3. Trends of mean trophic levels of fisheries landings
in the intertropical belt and adjacent waters. (A) Central Eastern Pacific
(FAO area 77); (B) Southwest, Central Eastern, and Southeast Atlantic (FAO
areas 41, 34, and 47); and (C) Indo (west)-Pacific (FAO areas 51, 57, and
71). |
 |
| The South Pacific areas (FAO areas 81 and 87; Fig. 4A) are interesting
in that they display wide-amplitude fluctuations of trophic levels, reflecting
the growth in the mid-1950s of a huge industrial fishery for Peruvian anchoveta.
Subsequent to the anchoveta fishery collapse, an offshore fishery developed
for horse mackerel, Trachurus murphyi, which has a higher trophic
level (3.3 +/- 0.21) and whose range extends west toward New Zealand (14). |
Fig. 4. High-amplitude changes of mean trophic levels
in fisheries landings. (A) South Pacific (FAO areas
81 and 87); (B) Antarctica (FAO areas 48, 58, and 88). |
Antarctica (FAO areas 48, 58, and 88; Fig. 4B) also exhibits high-amplitude
variation of mean trophic levels, from a high of 3.4, due to a fishery
that quickly depleted local accumulations of bony fishes, to a low of 2.3,
due to Euphausia superba (trophic level 2.2 +/- 0.40), a large krill
species that dominated the more recent catches.
The gross features of the plots in Figs. 2 through 4, while consistent
with previous knowledge of the dynamics of major stocks, may provide new
insights on the effect of fisheries on ecosystems. Further interpretation
of the observed trends is facilitated by plotting mean trophic levels against
catches.
For example, the four systems in Fig. 5 illustrate patterns different
from the monotonous increase of catch that may be expected when fishing
down food webs (15). Each of the four systems in Fig. 5 has a signature
marked by abrupt phase shifts. For three of the examples, the highest landings
are not associated with the lowest trophic levels, as the fishing-down-the-food-web
theory would predict. Instead, the time series tend to bend backward. The
exception (where landings continue to increase as trophic levels decline)
is the Southern Pacific (Fig. 5C), where the westward expansion of horse
mackerel fisheries is still the dominant feature, thus masking more local
effects.
The backward-bending feature of the plots of trophic levels versus
landings, which also occurs in areas other than those in Fig. 5, may be
due to a combination of the following:
(i) artifacts due to the data, methods, and assumptions used;
(ii) large and increasing catches that are not reported to FAO;
(iii) massive discarding of bycatches (16) consisting predominantly
of fish with low trophic levels;
(iv) reduced catchability as a result of a decreasing average size
of exploit-able organisms; and
(v) fisheries-induced changes in the food webs from which the landings
were extracted.
Regarding item (i), the quality of the official landing statistics we used
may be seen as a major impediment for analyses of the sort presented here.
We know that considerable under- and misre-porting occur (16). However,
for our analysis, the overall accuracy of the landings is not of major
importance, if the trends are unbiased. Anatomical and functional considerations
support our assumption that the trophic levels of fish are conservative
attributes and that they cannot change much over time, even when ecosystem
structure changes (17). Moreover, the increase of young fish as a proportion
of landings in a given species that result from increasing fishing pressure
would strengthen the reported trends, because the young of piscivorous
species tend to be zooplanktivorous (18) and thus have lower trophic levels
than the adults.
Items (ii) and (iii) may be more important for the overall explanation.
Thus, for the Northeast Atlantic, the estimated (16) discard of 3.7E6 t/year
of bycatch would straighten out the backward-bending curve of Fig. 5B.
Item (iv) is due to the fact that trophic levels of aquatic organisms
are inversely related to size (19). Thus, the relation between trophic
level and catch will always break down as catches increase: There is a
lower size limit for what can be caught and marketed, and zooplankton is
not going to be reaching our dinner plates in the foreseeable future. Low
catchability due to small size or extreme dilution (<1 g/m3 ) is, similarly,
a major reason why the huge global biomass (~10E9 t) of lanternfish (family
Myctophidae)
and other mesopelagics (20) will continue to remain latent resources.
If we assume that fisheries tend to switch from species with high trophic
levels to species with low trophic levels in response to changes of their
relative abundances, then the backward-bending curves in Fig. 5 may be
also due to changes in ecosystem structure, that is, item (v). In the North
Sea, Norway pout, Trisopterus esmarkii, serves as a food source
for most of the important fish species used for human consumption, such
as cod or saithe. Norway pout is also the most important predator on euphausiids
(krill) in the North Sea (3).
Fig. 5. Plots of mean trophic levels in fishery landings
versus the landings (in millions of metric tons) in
four marine regions, illustrating typical backward-bending
signatures (note variable ordinate and abcissa
scales). (A) Northwest Atlantic (FAO area 21); (B) Northeast
Atlantic (FAO area 27); (C) Southeast Pacific
(FAO area 87); (D) Mediterranean (FAO area 37). |
We must therefore expect that a directed fishery on this small gadoid
(landings in the Northeast Atlantic are about 3E5 t/year) will have a positive
effect on the euphausiids, which in turn prey on copepods, a much more
important food source for commercial fish species than euphausiids. Hence,
fishing for Norway pout may have a cascading effect, leading to a build-up
of nonutilized euphausiids. Triangles such as the one involving Norway
pout, euphausiids, and copepods, and which may have a major effect on ecosystem
stability, are increasingly being integrated in ecological theory (21),
especially in fisheries biology (22).
Globally, trophic levels of fisheries landings appear to have declined
in recent decades at a rate of about 0.1 per decade, without the landings
themselves increasing substantially. It is likely that continuation of
present trends will lead to widespread fisheries collapses and to more
backward-bending curves such as in Fig. 5, whether or not they are due
to a relaxation of topdown control (23). Therefore, we consider estimations
of global potentials based on extrapolation of present trends or explicitly
incorporating fishing-down-the-food-web strategies to be highly questionable.
Also, we suggest that in the next decades fisheries management will have
to emphasize the rebuilding of fish populations embedded within functional
food webs, within large no-take marine protected areas (24).
(*) we've used the notation E for powers of ten: 1E6 = 1 million
REFERENCES AND NOTES
-
1. S. M. Garcia and C. Newton, in Global Trends in Fisheries Management,
E. Pikitch, D. D. Hubert, M. Sissenwine, Eds. (American Fisheries Society
Sym-posium 20, Bethesda, MD, 1997), pp. 327.
-
2. FAO, FISHSTAT-PC: Data Retrieval, Graphical and Analytical Software
for Microcomputers (FAO, Rome, 1996).
-
3. V. Christensen, Dana 11, (1995). 4. The bulk of the 60 published models
are document-ed in (25); D. Pauly and V. Christensen, in Large Marine Ecosystems:
Stress, Mitigation and Sustain-ability Stratified, K. Sherman, L. M. Alexander,
B. D. Gold, Eds. (AAAS Publication, Washington, DC, 1993), pp. 148174;
D. Pauly and V. Christensen, Nature 374, 255 (1995). References to the
remaining models are given in FishBase 97 (9).
-
5. V. Christensen and D. Pauly, Ecol. Model. 61, 169 (1992).
-
6. The documentation of the Ecopath models in (3) and (4) includes sources
of diet compositions of all con-sumer groups in each ecosystem. These diet
com-positions are rendered mutually compatible when mass-balance within
each model is established.
-
7. As initially proposed by W. E. Odum and E. J. Heald, in Estuarine Research,
L. E. Cronin, Ed. (Academic Press, New York, 1975), vol. 1, pp. 265286.
-
8. J. H. Ryther, Science 166, 72 (1969).
-
9. All trophic level estimates are fully documented on the home pages of
the Fisheries Centre, University of British Columbia, (www.fisheries.com)
and of the FishBase project (www.fishbase.org), and on the FishBase 97
CD-ROM {R. Froese and D. Pauly, Fish-Base 97, Concepts, Design and Data
Sources [Inter-national Center for Living Aquatic Resources Man-agement
(ICLARM), Manila, Philippines, 1997]}, where references to the 60 published
Ecopath appli-cations are given as well. FishBase 97 also includes the
FAO statistics (2), so Figs. 1 through 5 can be reproduced straightforwardly.
To estimate the stan-dard error (SE) we used the square root of the vari-ance
of the estimate of trophic level, in agreement with S. Pimm (21), who defined
an omnivore as a species which feeds on more than one trophic level.
Thus, our estimates of SE do not necessarily express uncertainty about
the exact values of trophic level estimates; rather, they reflect levels
of omnivory. We do not present SE for the trophic levels of fisheries landings,
as fisheries are inherently omnivorous.
-
10. R. J. R. Grainger and S. M. Garcia, FAO Fish. Tech. Pap. No. 359 (1996).
-
11. Mean trophic level, TL i , for year i is estimated by multiplying the
landings (Y i ) by the trophic levels of the individual species groups
j, then taking a weight-ed mean, that is, TLi 5 ¥ijTLijYij / ¥Yij.
-
12. A. Jarre, P. Muck, D. Pauly, ICES Mar. Sci. Symp. 193, 171 (1991).
-
13. J. R. Beddington and R. M. May, Sci. Am. 247,42 (November 1982); P.
Dalzell and D. Pauly, Neth. J. Sea Res. 24, 641 (1989); contributions in
G. Silvestre and D. Pauly, Eds., Status and Management of Tropical Coastal
Fisheries in Asia (Conf. Proc. 53, ICLARM, Manila, Philippines, 1997).
-
14. R. Parrish, in Peruvian Upwelling Ecosystem: Dy-namics and Interactions,
D. Pauly, P. Muck, J. Mendo, I. Tsukayama, Eds. (Conf. Proc. 18, ICLARM,
Manila, Philippines, 1989).
-
15. V. Christensen, Rev. Fish Biol. Fish. 6, 417 (1996). 16. D. L. Alverson,
M. H. Freeberg, S. A. Murawski, J. G. Pope, FAO Fish. Tech. Paper 339 (1994).
-
17. We refer here to gill rakers, whose spacing deter-mines the sizes of
organisms that may be filtered, the length of the alimentary canal, which
determines what may be digested, or the caudal fin aspect ratio, which
determines attack speed and, hence, which prey organisms that may be consumed.
See S. J. de Groot [Neth. J. Sea Res. 5, 121 (1981)] for an exam-ple for
flatfish (order Pleuronectiformes).
-
18. A. R. Longhurst and D. Pauly, Ecology of Tropical Oceans (Academic
Press, San Diego, CA, 1987); A. P. Robb and J. R. G. Hislop, J. Fish. Biol.
16, 199 (1980).
-
19. Contributions in (25) document the strong correla-tion between size
and trophic level in aquatic eco-systems, a case also made for the North
Sea by J. Rice and H. Gislason [ICES J. Mar. Sci. 53, 1214 (1996)].
-
20. J. Gjøsaeter and K. Kawaguchi, FAO Fish. Tech.Paper No. 193
(1980).
-
21. S. Pimm, Food Webs (Chapman & Hall, London, 1982).
-
22. R. Jones, in Theory and Management of Tropical Fisheries, D. Pauly
and G. I. Murphy, Eds. (Conf. Proc. 9, ICLARM, Manila, Philippines, 1982),
pp. 195240; E. Ursin, Dana 2, 51 (1982).
-
23. M. E. Power, Ecology 73, 733 (1992).
-
24. A. C. Alcala and G. R. Russ, J. Cons. Cons. Int. Explor. Mer 46, 40
(1990); M. H. Carr and D. C. Reed, Can. J. Fish. Aquat. Sci. 50, 2019 (1993);
J. E. Dugan and G. E. Davis, ibid., p. 2029; C. M. Roberts and N. V. C.
Polunin, Ambio 6, 363 (1993).
-
25. V. Christensen and D. Pauly, Eds., Trophic Models of Aquatic Ecosystems
(Conf. Proc. 26, ICLARM, Ma-nila, Philippines, 1993).
-
26. D.P. acknowledges a Canadian (National Science and Engineering Council
of Canada) and V. Chris-tensen a Danish (Danish International Development
Agency) grant for the development of Ecopath. R.F. thanks the European
Commission (Directorate-Gen-eral VIII) for successive grants to FishBase.
We also thank H. Vatlysson and A. Laborte for a discussion and the FishBase
programming, respectively. This is ICLARM contribution number 1401.
22 August 1997; accepted 10 December 1997
-- seafriends home -- fishing
index --
.
'