Solving wide angle unsharpness How to adjust the primary lens for wide angle sharp focusing
by J Floor Anthoni (Dec 1982)
Published in Onderwater Wereld (in Dutch) and adapted here (2005).
Modern small frame cameras like Super8 do
not only bring a spectacular range of zoom but also a very useful wide
angle. But often their wide angle footage shows unsharpness which may be
caused by a slight misadjustment of the distance to the focal plane. My
suspicion was that the film does not run tight against the film guides
but a very small distance behind it. This article describes a method not
just to measure wide angle unsharpness but also to adjust the lens precisely
with the film running.
.
History Because the distance from lens to focal plane (emulsion) is very critical,
wide angle unsharpness is a common problem, but more so for small format
cameras like 16 and 8 mm film and video. I own two Braun NIZO S560 Super8
cameras both of which show unsharpness in wide angle footage, and on further
investigation I found that indeed most Super8 cameras suffer from this
problem.
I tried to have renowned camera repair shops readjust the optics, and even
sent a camera back to its manufacturer, however to no avail. So, what was
the cause of this unsharpness? I concluded that perhaps the film does not
run precisely in the same position where it comes to rest but slightly
further back, perhaps due to aerodynamic behaviour.
First I constructed a film cassette with an inbuilt tiny 'projector'
to project a scratched black film back onto the screen but this just showed
how critical it all was, as even the depth of the emulsion played a role.
I needed a method to measure unsharpness with the fim running. The problem
then becomes the test pattern which should not be perpendicular to the
optical axis but along it, so that the point of focus can be read from
the developed film. But this brought new problems such as a different apparent
unsharpness between letters and lines, and the apparent sharpness of lines
and letters nearer by. What I needed was a test scale with markings that
all appear equally large or wide, no matter their distance to the camera.
This led to the invention of the Optical Illusion Scale drawn by a computer
programme.
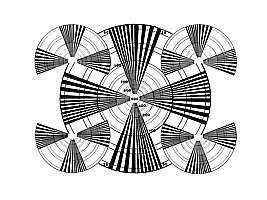
Many
test patterns exist for TV cameras to judge sharpness by, and this one
was designed by myself in order to judge corner to corner sharpness. The
aspect ratio of this image is 4:3 as is customary for video, Super8 and
16mm. Each circle contains horizontal and vertical tapering wedges in two
resolutions with concentric rings showing their spacings in equivalent
lines of resolution. You'll find this test pattern handy for testing your
camera and its various zoom settings. Make sure you frame the image without
much white surrounding it. Click on the image for an A4 sized printable
version (vidsharp.gif, 250KB). The problem with
this kind of test pattern is that it does not show where the lens focuses
most sharply. Is it in front or behind the test pattern?
Focal
plane sensitivity The diagram of a film camera shows how the subject is projected through
a secondary telelens A, through a semi-transparent prism B and through
a primary lens C onto the focal plane which is inside the Super8 cartridge.
At the point of the prism B, the light runs almost in parallel such that
the distance from the secondary telelens to the focal plane is not critical.
Because the light here forms a near parallel beam, it can be diverted through
a narrow tunnel around the cartridge where it meets another mirror and
more optics. In the eyepiece a virtual image is projected, which views
the subject at true distance. With the top mirror the position of the image
is adjusted with three screws and ultimate wide angle sharpness is adjusted
by turning the primary lens C.
Basic optics as discovered by Descartes, can be described in two ways
as shown in the diagram here. A lens projects an image located at infinity,
like the sun, at a precise spot located at the lens' focal point. Here
all sunrays concentrate to project a small image of the sun. Newton discovered
the symmetry of behaviour for rays inside and outside the lens and formulated
the basic optics with this symmetry in mind as B x V = f x f.
We will now use Newton's formula to calculate how sensitive a lens
is relative to shifts in its focal plane. We do this by moving the subject
V from 2m to infinity, examining the focal plane shift B for various lenses:
lens focal length mm
focal plane shift mm
200
20.0
50
1.25
25
0.31
10
0.05
5
0.012
As one can see, a misadjustment of 12 microns for a 5mm lens,
shifts the subject from 2m to infinity. It explains why wide angle lenses
are often unsharp. The table also shows that the effect proceeds quadratically,
and that depth of field which is what the table also shows, increases quadratically
with the inverse of focal length. Thus a 5mm lens has four times more depth
of field than a 10mm lens and 16 times more than a 20mm lens, and so on.
In
the test setup we place a 3 diopter closeup lens A in front of the camera
C which is set to focus at infinity. The optical illusion scale B is placed
in front at a slight angle. The focal point thus lies 1/3 metre or 333mm
in front of the lens, and this can be measured. Equally important, the
focusing wedge in the viewfinder optics must agree that this is the viewfinder's
point of focus too.
The camera is placed on a sturdy support to keep it in one place, and its
side opened to access the primary lens. With a white marker (like paper
correction fluid) the current position of this lens is marked and the amount
turned is noted on paper. For every part turn (typically 10 degrees), a
bit of film is run. Make sure to run quite a good length of film (10 seconds)
so that later you will have enough time to judge where its point of focus
is. About a quarter turn each way is enough. At the end of the test, the
lens is moved back to its original position and the film sent for development.
The developed film is projected repeatedly and its point of sharpness noted
from the picture.
Tip: write the setting on a piece of paper and attach it to the scale
so that it becomes recorded too.
Tip: you can use a 4 diopter closeup lens to focus at 1/4m or 250mm.
The optical illusion scale can then be smaller to fit on a normal sheet
of paper.
It is very important to shoot the film with wide aperture. In the case
of movie or video, this means that the intensity of the light needs to
be dimmed down. Here is what the camera sees, roughly a broad band of equal
width and marks of equal widths. Where the camera was focused, a clear
depth of field pattern emerges. Notice how the perception of depth of field
narrows towards the finer marks, another optical illusion. The example
here was photographed at 15cm f4 and the camera's autofocus was used for
focusing. The conclusion is that the autofocus and lens agree.
The
graph shown here is from an actual measurement. Horizontally it shows the
amount the primary lens was turned, in notches, both clockwise (CW) and
counterclockwise (CCW). Vertically the shift in focus as read from the
chart. Many points are needed because of the amount of uncertainty in reading
the focal point from the depth scale. The average curve drawn through all
the measurements shows that the present focal point causes 40mm unsharpness
on a distance of 333mmm, and that the exact focal point lies three notches
CCW. After making that adjustment, the lens indeed performed optimally.
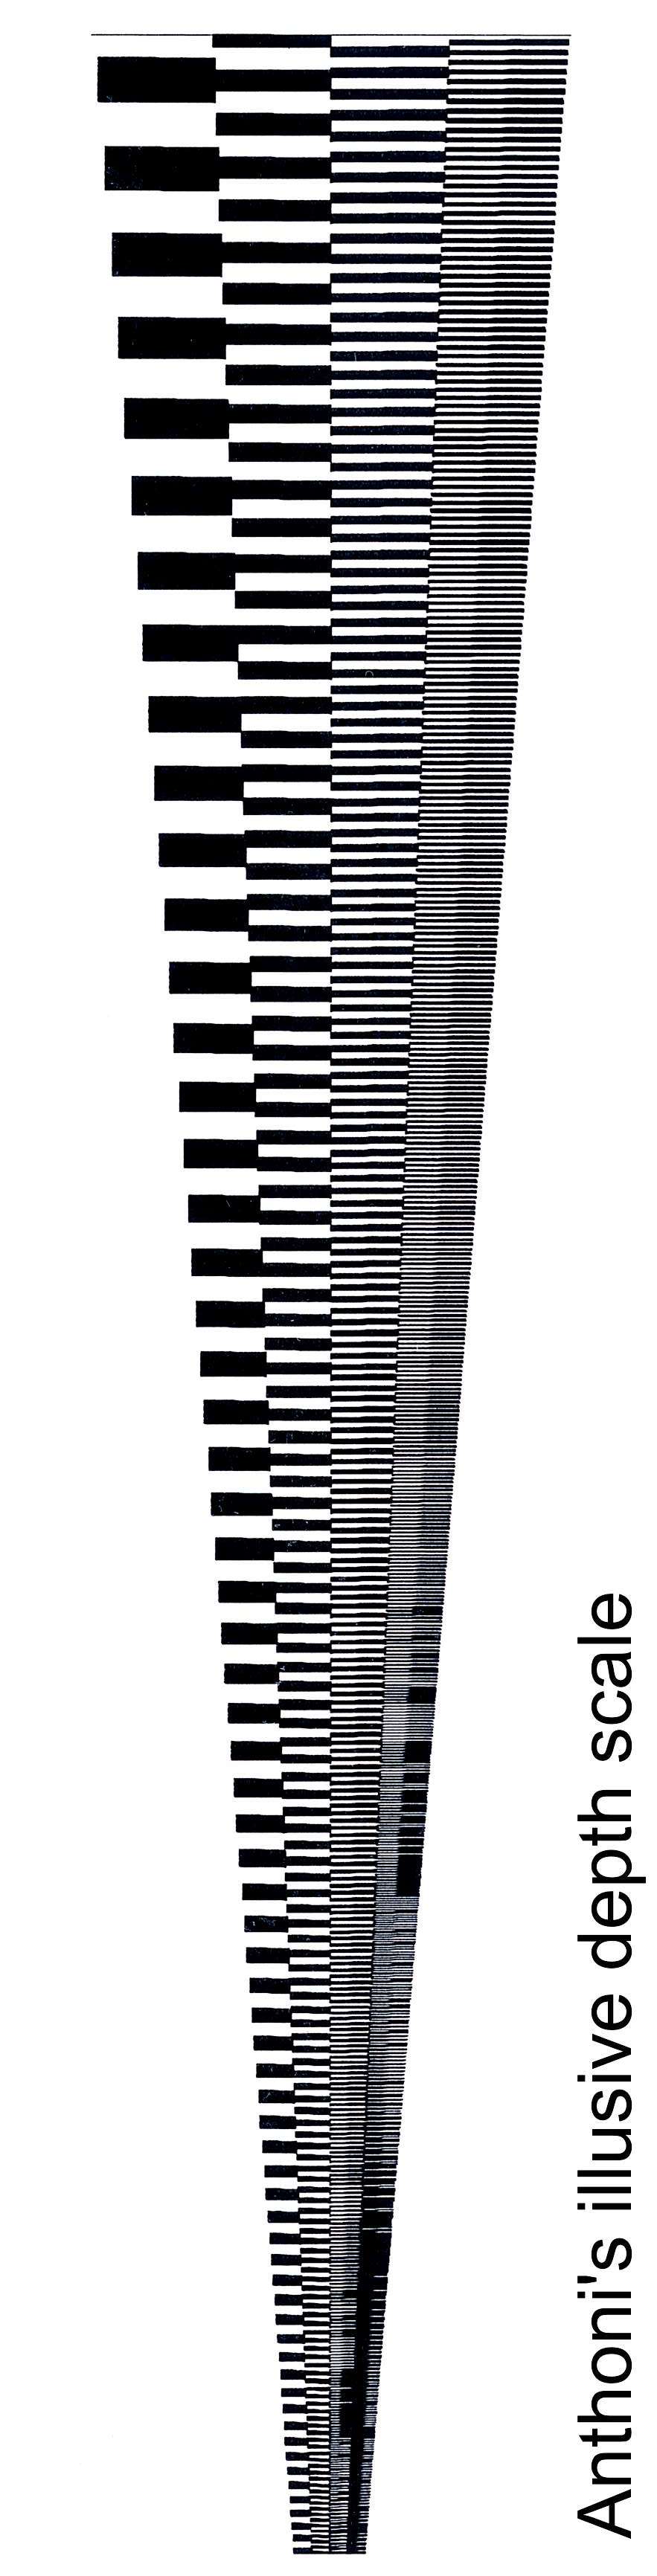
This is what the optical illusion depth scale looks like side-on. This
version begins at 5cm from the lens (left) and ends at 34cm distance. Red
marks have been placed for 15, 20 and 25cm. The 25cm mark can be used for
a camera with a 4 diopter closeup lens at its infinity distance setting.
Make sure aperture is maximally open.
Note that due to printer, plotter and scanner resolution the finest
graticules become messy where lines come close together. However, this
does not normally matter as coarser graticules are above these.
You can print a ready A4 version (250KB) ilusion3.jpg
The
optical illusion scale The Anthoni Optical Illusion Scale overcomes the illusion that what
is nearer appears larger and thus sharper, by creating the illusion that
all marks on the scale are of equal size. Thus marks become higher and
wider as they are located further away. The computer program to achieve
this was originally programmed for an Apple computer with Watanabe Miplot
plotter for A3 size paper. By running the program four times at different
settings, the Optical Illusion Scale is drawn.
Program
description The program shown above is a BASIC program for the Apple computer,
but in its simplicity can be transcribed for other situations. The variable
names used are explained in the diagram above the program. This makes the
INPUT section straightforward. In the main program loop the variable D
= distance to lens is incremented with half the pen width to achieve a
totally black mark. In statement 300, D is incremented by the width of
the mark to create a white mark.
The Miplot plotter needed integers in tenth of a millimetre for D, H2 and
H3, hence the 10 times multiplication factor. The 'M' command moves the
pen in statement 240 without writing. In statements 270, 280 the 'D' (Draw)
command draws the lines.
The standard scale was drawn in four runs for L= 4,2,1,0.5 H=
10,10, -10, -10 and Q= 10, 0, 0, -10 (mm) for ever finer blocks,
with fixed settings S=100, E=400, F=333, P=0.5
Note that if the marks are too high, they cannot fit inside the film
frame.
Tip: when developing your own program, begin with a wide pen of 0.5mm
to get quick results. For best resolution choose a fine pen of 0.1mm.
Here is another program version, this time programmed in WANG BASIC2c
for a KYOCERA printer. The printer's native PRESCRIBE2 commands were used
for plotting, as explained in the program. Because this is a laser printer,
all four sectors are drawn, one after another, before printing the page.
0005 REM Optical illusion scale. 20051017
0006 REM for WANG BASIC2C & Kyocera PRESCRIBE2 plot commands -
MAP= move to absolute position - DAP draw to absolute position - SPD set
pen diameter
0060 REM origin at top of paper: X=10.5: Y=0: REM pen dia in cm: P=.01
0065 SELECT PRINT 215(0): PRINT "!R!UNIT C;SPD";P;";EXIT;";
0070 REM in cm: REM focal pt: F=25: REM start: S=5: REM end: E=34
0071 REM sector 1: L=.4: H=1.0: O=1.0: GOSUB 100
0072 REM sector 2: L=.2: H=1.0: O=.0 : GOSUB 100
0073 REM sector 3: L=.1: H=-1.0: O=.0 : GOSUB 100
0074 REM sector 4: L=.05: H=-1.0: O=-1.0 : GOSUB 100
0090 PRINT "!R!PAGE;EXIT;": SELECT PRINT 005(80): STOP "DONE"
0100 REM subroutine draws one sector: D=S
0110 IF D>E THEN RETURN : REM width bar: W=D*L/F: REM end bar: N=D+W-2*P:
REM height bar: H1=D*H/F: REM elevation: H3=D*O/F
0120 PRINT "!R!MAP";X+H3;",";Y+D-S;";EXIT;";
0130 FOR D=D TO N STEP P/2: REM relative D: D1=D-S: H2=H1+H3
0140 PRINT "!R!DAP";X+H3;",";Y+D1;";DAP";X+H2;",";Y+D1+P/2;";EXIT;";
0150 NEXT D: D=D+W: GOTO 110
9988 REM RESAVET "ILLUSION"
 Many
test patterns exist for TV cameras to judge sharpness by, and this one
was designed by myself in order to judge corner to corner sharpness. The
aspect ratio of this image is 4:3 as is customary for video, Super8 and
16mm. Each circle contains horizontal and vertical tapering wedges in two
resolutions with concentric rings showing their spacings in equivalent
lines of resolution. You'll find this test pattern handy for testing your
camera and its various zoom settings. Make sure you frame the image without
much white surrounding it. Click on the image for an A4 sized printable
version (vidsharp.gif, 250KB). The problem with
this kind of test pattern is that it does not show where the lens focuses
most sharply. Is it in front or behind the test pattern?
Many
test patterns exist for TV cameras to judge sharpness by, and this one
was designed by myself in order to judge corner to corner sharpness. The
aspect ratio of this image is 4:3 as is customary for video, Super8 and
16mm. Each circle contains horizontal and vertical tapering wedges in two
resolutions with concentric rings showing their spacings in equivalent
lines of resolution. You'll find this test pattern handy for testing your
camera and its various zoom settings. Make sure you frame the image without
much white surrounding it. Click on the image for an A4 sized printable
version (vidsharp.gif, 250KB). The problem with
this kind of test pattern is that it does not show where the lens focuses
most sharply. Is it in front or behind the test pattern?
 In
the test setup we place a 3 diopter closeup lens A in front of the camera
C which is set to focus at infinity. The optical illusion scale B is placed
in front at a slight angle. The focal point thus lies 1/3 metre or 333mm
in front of the lens, and this can be measured. Equally important, the
focusing wedge in the viewfinder optics must agree that this is the viewfinder's
point of focus too.
In
the test setup we place a 3 diopter closeup lens A in front of the camera
C which is set to focus at infinity. The optical illusion scale B is placed
in front at a slight angle. The focal point thus lies 1/3 metre or 333mm
in front of the lens, and this can be measured. Equally important, the
focusing wedge in the viewfinder optics must agree that this is the viewfinder's
point of focus too. 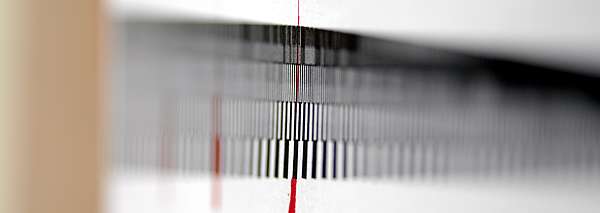
 The
graph shown here is from an actual measurement. Horizontally it shows the
amount the primary lens was turned, in notches, both clockwise (CW) and
counterclockwise (CCW). Vertically the shift in focus as read from the
chart. Many points are needed because of the amount of uncertainty in reading
the focal point from the depth scale. The average curve drawn through all
the measurements shows that the present focal point causes 40mm unsharpness
on a distance of 333mmm, and that the exact focal point lies three notches
CCW. After making that adjustment, the lens indeed performed optimally.
The
graph shown here is from an actual measurement. Horizontally it shows the
amount the primary lens was turned, in notches, both clockwise (CW) and
counterclockwise (CCW). Vertically the shift in focus as read from the
chart. Many points are needed because of the amount of uncertainty in reading
the focal point from the depth scale. The average curve drawn through all
the measurements shows that the present focal point causes 40mm unsharpness
on a distance of 333mmm, and that the exact focal point lies three notches
CCW. After making that adjustment, the lens indeed performed optimally.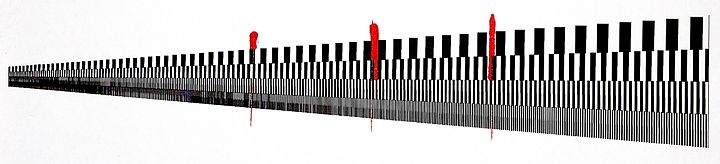