contents of this page
- The new sand mining proposal: A sand mining company proposes to take sand from deep water.
- Locality map: a bird's eye view of the entire area from Auckland to Whangarei.
- Society's need for sand: sand has become an indispensable resource for society's functioning.
- Sand for glass:
- Sand for concrete
- Sand for fill
- Sand for beach renourishment
- Geology: understanding the physical environment.
- The origin of the sand: sea sand comes from eroding land.
- Geology of the Hauraki Gulf: the Gulf has a surprising history.
- Sustainability: how much sand is there and can it be mined sustainably?
- Threats to beaches and dunes: beaches and dunes can suffer from the mining of sea sand. Where should we mine?
- Where does the beach end? recent findings give some clues.
- Places where sand could be mined: sand is not deposited equitably, and in some places hinders beach self-repair.
- The present situation: how much sand is already being taken from the sea?
- Pakiri Beach
- Te Arai Point
- Mangawhai
- Consequences of mining the sea sand: the act of dredging can be threatening the environment.
- Reasonable and effective restrictions: mining sea sand in an environmentally friendly way.
- Appendices
- Concrete, its use and how it is made: much sand is used for making concrete. What is involved?
- Glass and how it is made: glass is made from sand. It has been an important resource for mankind.
- Related information: related knowledge, not found on this page
- References: books and publications
- Statement of evidence of the Company's consulting engineer, explaining situation and methods. (9 pages)
The new proposal by Kaipara Excavators, is to mine designated areas
of the continental shelf close to Auckland (see map) for an amount of 2
million cubic metres (2 Mm3) of sand at depths of 25-60 metres, and over
an area of 500km2, in the course of 35 years. If such sand were taken equitably
from the entire area, it would amount to no more than a fraction of a millimetre
per year. But the fear exists, that the operation will affect nearby beaches.
For details of the proposal, read the consulting engineer's statement
of evidence (9 pages).
From an environmental viewpoint, disturbing such a large area, even
once in thirty years, would disturb the bottom communities which together
form the sea soil. With the knowledge that ploughing fields on land causes
serious disturbance to soil, it is feared that the operation may invoke
profound ecological changes that could affect the entire continental shelf
ecosystem.
In New Zealand, the Resource Management Act requires anyone affecting
either land, water or air, to apply for a resource consent. Managed by
the regional government authority, the proposal inevitably finds its way
to the Environment Court, where objectors can make submissions.
|
|
|
Sand for glass
Glass is made chiefly from high quality, clean sand. It is a hard,
clear, inert substance which is formed at high temperatures, and is extremely
resistant to wear, tear, and ageing. Glass is used extensively by society
for window-glazing, liquid containers, and glassware. Small quantities
of specialty glass are used for optics, electronics (lasers, fibre-optics,
semiconductors). Read more about glass and glass making in the box
below.
Sand for concrete
Liquid stone, or concrete as it is named, was invented before the first
world war, but became popular in the second world war. It was used in the
construction of military bunkers, airfield tarmac and roads. Concrete is
basically made from hard rock. Rock is broken (crushed) into small pieces
(between 20 and 40mm maximally), then sieved (graded) into various size
grades from 'dust' to 40mm aggregate. Mixed with cement and water, the
mixture is poured in place and left to harden. This hardening is a chemical
process of growing cement crystals, consisting of long, microscopic fingers
which enmesh the rock grains, while securely attaching to them. Within
7 days most of the strength is attained, but hardening takes another three
weeks to reach design strength. The more cement added, and the harder the
rock, the stronger the concrete becomes.
Sand is needed (about one third) because the broken rock, does not
fit neatly together again. Like the aggregate rock, the sand must also
be strong and clean, for the cement crystals to attach to. Unlike the broken
rock, sand can become polluted by its environment, rendering it less suitable.
Inclusions of mud, silt, clay and organic matter affect concrete strength
considerably. Hence the need for clean ('sharp') sand. Beach sand, being
washed over and over again by every wave pounding on the beach, is preferred.
It consists mainly of extremely hard quartz (SiO2, silicon dioxide). In
order to predict concrete quality reliably, sand must also be of consistent
size. Sea sand, containing over 10% moisture by weight, needs to be washed
to remove its salt. Quality sand for concrete comes close to NZ$25 per
cubic metre.
Read more about concrete at the end of this
document.
Sand for fill
Sand has a number of desirable properties for use as foundation underneath
parking places, buildings and roads: it drains groundwater freely and it
stays put, unlike soil or clay which can slide more easily. Sand does not
expand or contract with changing moisture content, and resists high loads
without sliding or compacting. Where sand contains high levels of mud,
these qualities are compromised. A high lime content from broken shells,
may cause the sand foundation to shrink over time due to acid rainwater
slowly dissolving this lime.
Sand for beach renourishment
It has become common practice to renourish ailing beaches with new
sea sand, particularly in very popular places where the cost can be justified
economically by many visitors. In New Zealand the cost of one cubic metre
of renourished sand is about NZ$40 (year 2000). It is believed that coarse
sand stays on renourished beaches longer than fine sand. It is less prone
to be moved by wind, so it won't blow into built-up areas, and being larger
than the original sand, stays on top of it. Beach sand needs to be clean,
but may include shells.
Note that the main component of sand is silica (silicon dioxide, SiO2) an extremely hard and slow-wearing substance, which may have originated from soil or volcanic eruptions a million years ago. Since no carbon is found inside silica, it cannot be carbon-dated. In between the sand grains, one also finds shell (calcium carbonate, CaCO3) and organic matter, which can be carbon-dated.
 |
This diagram shows the profile of a beach
with an exaggerated vertical scale. The depth of 40m is reached 2-6km out
in sea. At this scale the modern sand (Holocene sand) lies 6-10m deep on
the dunes, 2-6m deep by the beach and only 0.2-0.3m at 30m depth. All this
sand belongs to the beach/dune system, and behaves as a non-renewable resource.
Over the mid shelf, the sand is fine and mixed with mud. Deeper still,
only mud is found. Underneath the Holocene sand, a deep layer of iron-tainted
Pleistocene sand is found, and beneath that the bedrock.
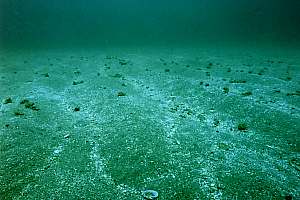
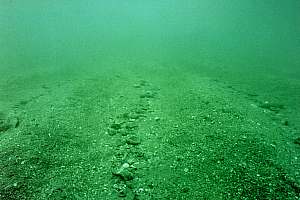
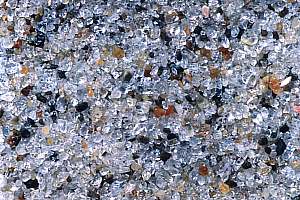
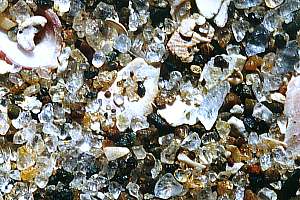
In the photos below, the nature of the deep sand can be
seen. Even at 42 metres depth, the sand is stirred occasionally by large
storm waves, which 'winnow' the fine sand and sweep it forward to the beach.
The coarser sand and shell remain..
|
 . . |
 |
 The
latest additions to the pool of sand come from present-day rivers, but
before it becomes a play ball of the water, sand is formed from rock by
weathering under a layer of soil and vegetation. Although sand grains are
found in sand stone and consolidated beach sand, they are not part of the
earth's crust or of metamorphosed rock, nor even of mud stone. During the
weathering process, the chemical composition of rock is changed, and in
the process, sand is formed from dissolved silicates. Other products formed
are clay and silt. Together they form the many kinds of loam. From the
loams, under influence of vegetation, soils are formed.
The
latest additions to the pool of sand come from present-day rivers, but
before it becomes a play ball of the water, sand is formed from rock by
weathering under a layer of soil and vegetation. Although sand grains are
found in sand stone and consolidated beach sand, they are not part of the
earth's crust or of metamorphosed rock, nor even of mud stone. During the
weathering process, the chemical composition of rock is changed, and in
the process, sand is formed from dissolved silicates. Other products formed
are clay and silt. Together they form the many kinds of loam. From the
loams, under influence of vegetation, soils are formed.
When soils erode, they wash into the rivers.
The particles are sorted out depending on the speed of the current - first
in the river and later by waves in the sea. Large particles such as pebbles,
settle out in the lower reaches of rivers and close to their mouths. Sand
stays along the coast to form beaches and dunes. Silt and clay are washed
down to the deep. The sedimentation and erosion diagram below shows how
currents erode and deposit various grain sizes of sand and rock. The scale
both horizontally and vertically is highly compressed (logarithmic). Sand
with grain sizes between 0.2 and 1.0 mm (mostly 0.25-0.5mm) form beaches
and dunes because they can be transported by both wind and waves, while
being able to stay put once laid down. The finer silt and clay particles
are reluctant to settle out, but once a cake has been formed, are difficult
to move.
It is wrong to assume that coastal erosion adds sand to the coastal
sand budget, because the weathering described above, has not happened.
But it does add fine rock particles. At any rate, the amount of sand entering
the sea, depends on the size of the catchment area, rainfall and erosion
rates (land use). For the Pakiri coast, the catchment area is extremely
small, which also accounts for its usually clear waters.
Later, the Waitemata Basins lifted up and the sandstones, siltstones and mudstones emerged to be the materials which have in turn weathered to produce the soil of the present catchments. These Waitemata rocks were not subjected to the high pressures and temperatures needed to change them into recalcitrant material (like greywacke). They are mostly soft and easily eroded.
Two major tectonic events, or deformations, subsequently
determined the overall form of the region as we see it today. A large,
long block of the basin's greywacke downfaulted (slumped or sank) to form
the Firth of Thames and the central Hauraki Gulf, into which the ancient
ancestral Waikato River flowed and transported the debris of the central
volcanoes of the Taupo region. The other event was that Northland gently
uplifted and tilted downwards to the west.
The sandstones, etc. were then, in their turn, eroded
and their debris washed into the Hauraki Gulf, and after the rise in sea
level, also into the tideways. There have been many rises and falls of
sea level (about 30). The processes of sediment erosion and accumulation
are still active. Sediments with depths of 10-20m have been measured in
the Waitemata and Mahurangi harbours. Rates of sediment accumulation, averaged
over the time since the tideways were first flooded, have been estimated
to be about 1-2 mm/yr.
(After Harris, T F W: Hauraki Gulf Tideways, elements
of their natural sciences. Univ Auckland Leigh Lab Bull No 29, 1993.
 The
Hauraki Gulf was formed when a large block of continental crust slumped
500-2000 metres downward, leaving a wide and deep valley to be filled by
the Waikato River, which flowed into the Gulf at the time. A large quantity
of sand, gravel and other deposits, is found here, filling the undersea
chasm above a bedrock of metamorphosed greywacke rock. Heat and pressure
will slowly solidify and metamorphose these new deposits, but near the
surface, a very large amount of 'old' sand is found, which is still loosely
packed. During the last 250,000 years, the sea level rose and fell perhaps
as many as 30 times, and its average elevation has been about 45m below
present sea level, which has occurred for only 5% of the time. The Waikato
River alternated its course from the Firth of Thames to the West Coast
several times. 220,000-65,000 years ago and 25,000-20,000 years ago it
flowed into the Firth of Thames.
The
Hauraki Gulf was formed when a large block of continental crust slumped
500-2000 metres downward, leaving a wide and deep valley to be filled by
the Waikato River, which flowed into the Gulf at the time. A large quantity
of sand, gravel and other deposits, is found here, filling the undersea
chasm above a bedrock of metamorphosed greywacke rock. Heat and pressure
will slowly solidify and metamorphose these new deposits, but near the
surface, a very large amount of 'old' sand is found, which is still loosely
packed. During the last 250,000 years, the sea level rose and fell perhaps
as many as 30 times, and its average elevation has been about 45m below
present sea level, which has occurred for only 5% of the time. The Waikato
River alternated its course from the Firth of Thames to the West Coast
several times. 220,000-65,000 years ago and 25,000-20,000 years ago it
flowed into the Firth of Thames.
Little Barrier Island, Great Barrier Island and the Coromandel ranges
were formed about 2 million years ago by extensive volcanism. The young
volcanic deposits and ashes also filled the rift valley. The drawing shows
an actual cross section of the sea bottom between Leigh and Mokohinau Islands
in a north-easterly direction. It shows how the greywacke bedrock drops
down to 'unplumbed depths', and that a thick layer of unconsolidated sediment
is found under the sea bottom (after Ferguson, 1974). This layer may contain
a large store of sand that may one day be mined. The amount of Pleistocene
sand in the Pakiri-Mangawhai embayment ranges from 9m (at 10m depth) to
36m (at 40m depth) and comprises 1,700 - 3,000 million m3.
The map also shows the extent of the new coastal management zone, the (Greater) Hauraki Gulf Marine Park.
Ferguson, S R: The velocity structure of the sea-bed
and basement rocks between Leigh and the Mokohinau Islands. MSc Thesis,
Univ Auckland, 1974
Hayward, B W: Origin of the offshore islands of Northern
New Zealand and their landform development. NZ Dept Lands & Survey
Inf Series No16: 129-138. 1986.
Hochstein, M P et al: Structure of the Hauraki Rift
(New Zealand). Royal Soc NZ Bull 24, 1986.
In order to find answers to this question, the Auckland Regional Council
(ARC) commissioned a sand study in 1994. Its report became available in
1998 for stake holders, and in 2000 for the general public. Based on sound
scientific investigations done by NIWA (National Institute for Water and
Atmosphere), new insight was gained into the physics, geology and movements
of the sand. These findings have been used throughout this article.
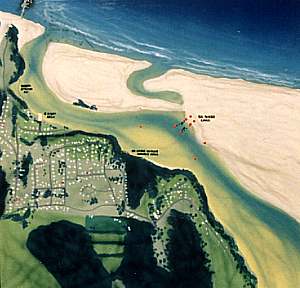
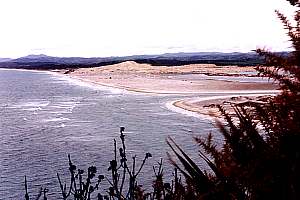
The
Pakiri-Mangawai sand system is bounded by rocky promontories in the north
and south. Deep waves arrive from the north-east through the gap between
Great Barrier Island and the Hen and Chicken Islands. Sea winds are predominantly
easterly (westerly winds are land winds). These two forces move the sand
around in the area, but little escapes. The easterly winds, generated locally,
cause short waves breaking on the beach and moving the beach sand NW along
the beach in the littoral zone (estimated 0.78 Mm3/yr). By the headlands,
the sand moves into deeper water where it is moved back towards the beach
in a SW direction by large storm waves arriving from the NE. The sand store
here is thus essentially static, but how much new sand arrives from erosion?
 As
seen from this map, the rain catchment area is rather small, and thus the
amount of sand entering the bay. Scientists estimate it at 8,000m3/yr,
less than 1/10th of the amount of sand mined today (102,000m3 taken against
a permit of 165,000m3/yr). Assuming a catchment area of 200km2 (20,000ha)
and erosion of 0.1 mm/yr (1 m3/ha), containing 30% sand, the simple estimate
(7,000 m3/yr) made this way, matches the official estimate very closely.
The point is, that the sea sand in this area is essentially a non-renewable
resource. Then how much of it is is available and how soon are we likely
to run out?
As
seen from this map, the rain catchment area is rather small, and thus the
amount of sand entering the bay. Scientists estimate it at 8,000m3/yr,
less than 1/10th of the amount of sand mined today (102,000m3 taken against
a permit of 165,000m3/yr). Assuming a catchment area of 200km2 (20,000ha)
and erosion of 0.1 mm/yr (1 m3/ha), containing 30% sand, the simple estimate
(7,000 m3/yr) made this way, matches the official estimate very closely.
The point is, that the sea sand in this area is essentially a non-renewable
resource. Then how much of it is is available and how soon are we likely
to run out?
Scientists estimate the amount of sand in the rear dunes at 92-552 Mm3 (1000-5000 yr); in the foredunes 1.4 Mm3 (14 yr); Holocene sand on the sea bottom 82-142 Mm3 (80-140 yr); Pleistocene sand under the Holocene sand 1.7-3.0 Gm3 (170,000-300,000 years). Although the yearly takings are about 100,000m3, and expected to double in the coming 50 years, the amount of sand found here appears sufficient in perpetuity. The area of 500km2 (some of which outside the area of study) for which a 2Mm3 mining licence is sought, contains 0.1-0.3m of Holocene sand (wedge-shaped), or about 100Mm3 (1000yr).
The question arises what would happen once the Holocene sand on the
sea bottom has been used up. Would the underlying Pleistocene sand change
its properties once it is stirred around? Would it become clean like the
Holocene sand?
In previous ice ages, when the sea level fell, the shoreline would
move back out to sea, leaving the Holocene sand behind. As the wave action
reached deeper sand, this would be swept towards the receding shoreline,
effectively being cleansed in the breaker zone. At the height of the new
ice age, the shoreline would remain static, collecting the Pleistocene
sands, and adding newer sands, which will eventually be swept to the present
shoreline at the end of the new ice age. Most likely, the brown Pleistocene
sand would 'scrub up' fine, but there is no proof. In the meantime, it
would be quite suitable for low quality fill.
.
As a wave spills and rushes onto a beach, it drags sand up the beach slope. The returning wave washes it back again, but being less powerful, leaves some sand behind. In the area between low and high tide, much sand is moved, but mainly to and from the shore. Under the influence of currents (often induced by winds), sand is easily moved in the wave zone along the beach. This is called littoral along-shore sand drift.
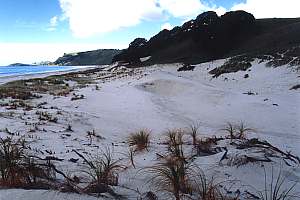
Once the tide recedes, the newly deposited sand starts to dry in the sunlight and sea wind. Once dried, the sea wind blows it to the dunes. The sand grains are too heavy to be air-borne, but saltate (jump) instead. In the lee of the foredune or of dune grasses, they stop moving. Sand accrues there. It is the combination of waves, sunlight, tides and wind that enable dunes to repair storm damage. These forms of energy essentially create a sand pump which pumps sand out of the water, effectively protecting the land from the sea. Once this mechanism is damaged, repair progresses more slowly (the beach is sick), and in some cases fails altogether (the beach dies). Beaches then continue to recede permanently.
Symptoms of sick and dead beaches are: steep scarps in the foredunes, left from a previous storm; a wide flat beach with 'hard' sand, which never dries; sand banks out in sea; polluted sand. Most beaches all over the world (70%), suffer from some or all of these symptoms, caused by the legacy of human civilisation: pollution, run-off, nutrients, sewage, building, shelter belts, and even dune plantings.
The shape of beaches, dunes and the sea bottom is maintained by the balance of forces that create them (tides, waves, wind, sun) and those that pull them down (gravity, rain). Wind and weather have a decisive influence, causing the beach profile to change from day to day, season to season and year to year. When sand is taken from this equation, a new balance will be found, and a new profile. In this manner, mining the sea sand can have a profound effect on the whole system and its entire profile. Where sand moves quickly (the beach), changes are felt soon, but where sand moves slowly (deep water), changes may not manifest themselves for decades. The question thus arises, where is the best place to mine the sand?
The cleanest, and thus most valuable sand is found in foredunes, beach and near-shore. But this is also the most sensitive band since its slope is steepest. Mining sand from this area will inevitably result in beach erosion. To prevent beach retreat, one should mine the areas with the least slope: the rear dunes and the deep sand. Most of the rear dunes have in the course of a century been planted, and the sand polluted by humus and trapped sediments. Likewise, the deep sand is being polluted by mud from unnaturally high soil erosion. A relatively narrow band between 25 - 60m depth (the inner shelf) gives the best compromise. Removing the Holocene sand found here will not influence the beach/dune system.
The question now is whether the sand removed from near-shore, will be
replaced by off-shore sand and how soon. Sand removed from 6-10m depth,
will most likely be replaced by beach sand to restore the balance, since
the slope here is steepest. Deep storm waves will eventually move sand
from deeper down (10-25m) towards the beach, but this may take many decades.
However, when it happens, the sand is moved massively and over a huge area.
So far, scientific knowledge about this process, is almost entirely lacking.
 This
diagram shows how the quality of the sand changes with depth. The red curve
is the bottom profile, running from the dunes at 10m height on left, to
a depth of -46m, on right. Vertical red lines show milestones of 10, 20,
30, and 40m depth along this profile. The coloured areas show the relative
composition (0-100%) of the sea sand. According to the Wentworth scale,
particles are defined as: mud less than 0.125mm; fine sand 0.125 - 0.25;
medium sand 0.25 - 0.5 mm; coarse sand 0.5-1.0 mm. Note that the sand was
taken from the surface of the sea bottom. Note also that this diagram applies
only to Pakiri Beach. Other beaches may be more sheltered, having more
gradual bottom profiles, or they may have a smaller continental shelf.
However, the underlying principles may well apply to all beaches.
This
diagram shows how the quality of the sand changes with depth. The red curve
is the bottom profile, running from the dunes at 10m height on left, to
a depth of -46m, on right. Vertical red lines show milestones of 10, 20,
30, and 40m depth along this profile. The coloured areas show the relative
composition (0-100%) of the sea sand. According to the Wentworth scale,
particles are defined as: mud less than 0.125mm; fine sand 0.125 - 0.25;
medium sand 0.25 - 0.5 mm; coarse sand 0.5-1.0 mm. Note that the sand was
taken from the surface of the sea bottom. Note also that this diagram applies
only to Pakiri Beach. Other beaches may be more sheltered, having more
gradual bottom profiles, or they may have a smaller continental shelf.
However, the underlying principles may well apply to all beaches.
Close to the beach, the sand consists mainly of fine sand, which is
capable of being moved by wind, thus forming part of the dune system. Fine
sand also moves easily in the water, and up a steep beach slope. It is
also easily moved away from the beach. Near the beach the sand is moved
so often that it is cleansed from mud.
Further out, the sand is mainly of medium size, easily moved by waves
but less so by wind, but such sand still forms dunes. Then comes an area
of mainly coarse sand, which is not easily moved by waves, and is left
behind, while its finer sand component was winnowed out by the wave action,
moving towards the beach, possibly 4000 years ago when the sea level was
lower. Then suddenly, the composition changes to fine sand and a substantial
amount of mud comes in. This is the area where even large waves cannot
move the sand towards the beach, and mud is soaked up by the fine sand.
Deeper still where the waves are very seldom felt, the mud can settle out
on top.
It is obvious that the sand mixed with mud (deeper than 40m), is moved
so rarely, that it cannot be a part of the beach-dune system. Whereas the
composition of the sand changes quite rapidly between 0 and 20m, and between
30 and 40m, it stays relatively constant between 20 and 30m. In this area
the bottom slope also changes, to become flat. It means, that although
the force moving sand out to sea is minimal here, the sand is not being
winnowed in recent times, meaning that the movement towards the beach is
also minimal (see note below). So, somewhere between 20m and 30m depth,
the Pakiri beach effectively ends. This is called the closure depth.
| Is sand moved outward
by gravity?
How does the sand move from shallow water to deeper water when the slope is so little? We would have thought that gravity is the major driving force, but this is not so, at least not in the sense of pushing particles down-hill. Gravity just makes them drop down and settle out and stay put. Particles are moved out to sea by a process of chance. When storm waves become asymmetrical with a steep high crest followed by a long shallow trough, the forward sweep under the crest is much faster than the backward sweep under the trough, resulting in particles being swept towards the beach. In deeper water where storm waves begin to stumble, they are still mostly symmetrical and the forward sweep equals the backward sweep. When strong enough, this dislodges sand particles, suspends them momentarily and then lets them settle again. Particles thus randomly move forward and backward, and they can be moved this way over large distances. By chance some are moved into deeper water and because the strength of waves diminishes quickly with depth, they are more likely to stay put. Thus it is the difference in depth which influences the strength of the wave action, that makes particles move to deeper water. Not just gravity alone. |
| Places where sand could be mined
Sand is not deposited equitably along dune-backed beaches. There are places where it is deposited to excess: in tall rear dunes, near headlands and in sand banks in sea. As argued in Why our beaches are disappearing, such excess can be harmful to the beach/dune system, and can in fact even be desirable for extraction. But essentially all the sand to a depth of around 30 metres belongs to the beach/dune system. |
Excessive amounts of sand are often experienced as a nuisance to society, such as encroaching rear dunes, sand in navigation channels and boat harbours, sand passing entrances to ports and so on. Such places are mined for economical reasons, producing sand while solving problems at the same time.
 |
 |
 |
 |
 |
 |
 |
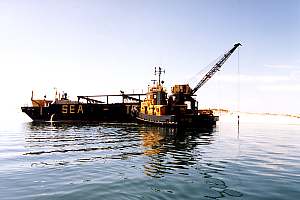
Consents for extraction 5km north and south of Te Arai Point for 1994-2004:
McCallum Bros Ltd - 45,000 m3/yr; Sea Tow Ltd - 25,000 m3/yr; Kaipara Excavators
Ltd - 45,000 m3/yr.
 |
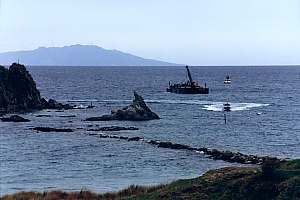
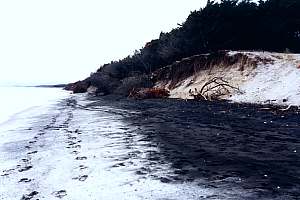
 The main problem here is the dirty water from the Mangawhai River, which soils the sand and beaches, impairing their natural sand pumping ability. In the background the tall forest threatens the beaches and dunes. |
Consents for extractions at the entrance to Mangawhai Harbour, 1994-2004:
Sea Tow Ltd - 25,000 m3/yr and M P Wilkinson - 25,000 m3/yr
 The
mining company proposes to skim the surface of the sea bottom, spreading
its impact over a large area. It obviously aims to skim the deep layer
of new sand, only 10-30 cm thick. But in this layer, marine organisms have
settled, and they have produced shells and they have trapped fine sand,
thus diminishing the sand's quality. Skimming the surface of the sea bed
would also disturb an unnecessarily large area, while retrieving sand of
poor quality. It would be better in this respect to stay stationary and
take the sand from deeper down, making potholes. But such dips in the bottom
could cause damage to trawler fishing gear, while lasting for many years.
A compromise could be set at 1-2m hole depth.
The
mining company proposes to skim the surface of the sea bottom, spreading
its impact over a large area. It obviously aims to skim the deep layer
of new sand, only 10-30 cm thick. But in this layer, marine organisms have
settled, and they have produced shells and they have trapped fine sand,
thus diminishing the sand's quality. Skimming the surface of the sea bed
would also disturb an unnecessarily large area, while retrieving sand of
poor quality. It would be better in this respect to stay stationary and
take the sand from deeper down, making potholes. But such dips in the bottom
could cause damage to trawler fishing gear, while lasting for many years.
A compromise could be set at 1-2m hole depth.
Estimating about 200 working days at sea per year, the daily quantity
taken would amount to 350m3 (50 truck loads). When skimming the bottom
to 0.3m, an area of 1000m2 is stirred daily (a quarter acre section). When
dredging to 1.2m, only one quarter of that will be disturbed every day.
When
dredging to 0.1m, as proposed, an area of 3000m2 is stirred daily. Because
the track is effectively 0.3-0.5m wide, a much larger area is affected,
while 10km of track is made each day. This track is comparable to that
drawn by the otter boards of a common fishing trawler. However, one such
trawler makes over 100km of such tracks each fishing day, while being only
one of the many fishing trawlers operating in this area. Yet when one dives
down to the sand bottom, one seldom finds a track, which indicates that
natural perturbation by storms and animals is high.
Undoubtedly the sand will be sieved as it is pumped up, and the dregs containing shell and other material, dumped overboard. Raining down on the bottom, they will remain on top like a suffocating blanket, possibly impairing the functioning of the sea soil beneath. But the larger marine organisms will also be returned to their habitat this way. By the digging action of large sea soil organisms, the soil is turned regularly, but it is not known how often and to what depth. Burrowing sea organisms like the tuatua clam live right in the breaker zone, being active enough to keep up with the constant churning of the sand. The deeper living tawera is also a rapid burrower. Because it is proposed to trailer-dredge shallow, narrow strips, blanketing of the sea bottom will not be a problem. The organisms living in the sea soil are used to being disturbed regularly by large storms.
As the sand is suctioned, a plume of silt will develop, both over the bottom and near the surface. It will pollute the sea water for some time, and promote plankton blooms from the released nutrients. Poisons such as heavy metals and hydrogen sulphide, locked up over time within the sea soil, are released again. Whereas river plumes happen only after large rains, this plume will be there most of the year, although changing location frequently. In late summer, when a thermocline has developed in mid water, effectively preventing the bottom-released nutrients from reaching the surface, the surface plume will exercise its fertilising effect most. However, its size is very small compared to that of rivers and it moves around constantly. Large storms also stir the bottom, releasing mud and nutrients, while mixing the water column.
There is some fear that the bottom fauna (there is no flora through lack of sunlight), could suffer permanently from the disturbance. But the bottom at 30-50m depth is stirred by storms once each year to once every ten years, to a soil depth of perhaps 0.2m, over very large areas at a time. Beyond that depth, the sea bottom is essentially static. From an ecological perspective, the soil fauna lives from what rains down from above, essentially dead plankton and higher organisms. Much like land soil, the sea soil decomposes it under the influence of oxygen, returning the resulting nutrients to the water. Most of the action is provided by bacteria and worms. Other organisms are found, either predating on these, or also living from the rained-down food source (clams). All of these are used to bottom disturbance, being capable of rebuilding their homes and numbers rapidly. For over 100 years already, the sea bottom in this area has been trawled for fish. The otter boards on trawler gear draw furrows in the sea bottom, and they operate to depths of over 200m. The furrow made by suctioning sand is of the same size as that marked by a trawler, but one trawlers makes about 8 times more of it in a day.
In some places the sea bed is known to have sensitive long-lived animals like sponges, bryozoa and coral-like organisms. These are attached to solid rock, which is not overlaid by sand. Dredging there would mortally damage these, but would not be very profitable. The Hauraki Gulf is essentially a deep valley, filled with sand. Bare rock can be found only near islands or rocky shores, and perhaps in some places off the continental shelf, where the sea bottom moves under the influence of gravity. By staying well away from any coast, such sensitive areas would effectively be protected. A condition of the resource consent is that if monitoring reveals bottom living communities of unexpected density and diversity, dredging is to be discontinued in that area.
The worst fear is that the mining company will operate near existing
shores, where known quantities of quality sand are found. Such sand exists
not only in very limited supplies, being essentially a non-renewable resource,
but also belongs to the beach/dune system with which it relates dynamically
through the balance of gravity (moving away) and long waves (moving toward
the beach). Taking this sand will ultimately affect nearby beaches and
dunes.
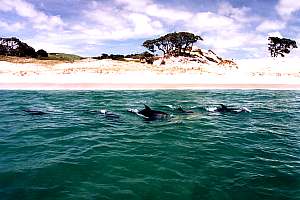
The beach and dunes have high amenity value, particularly those which
are still clean and pristine. The Pakiri Beach, although being under threat
from pollution (Pakiri River and Mangawhai River sediment) and inappropriate
coastal land use (forests, dune planting, housing), is still a healthy
beach, sought after by holiday makers and day trippers from Auckland and
further. It is used for swimming, walking, surfing, fishing, shellfish
gathering, horse riding, and more. By dredging in
water deeper than 25m, there should be nothing to fear in this respect.
Because sand mining at these depths and this area has not been done before, provisions must be made to enable scientific monitoring and the gathering of information. Quantities of sand taken, its composition and place must be recorded. The company should have some flexibility in its operation, since it will encounter new technological problems. The plan provides for elaborate monitoring during the sand mining. Position and quantity of sand taken will be known, and sand samples analysed for their biotic communities.
It must also be understood that the licence to operate is not exclusive and that other operators are allowed to operate in the area in due time. In this manner an effective monopoly is prevented. Mining the sand is not a right but a privilege bestowed upon the miners, by the people of this country who speak also for generations yet unborn. Although the mining company expressly states that it is not seeking an exclusive licence on occupation, it is not clear whether that excludes others from mining there. By claiming such a large area, which includes all the takeable sand, the company effectively excludes others.
Since mining at these depths has not been undertaken in this country
before, technological challenges will undoubtedly occur. The Company should
have a reasonable degree of freedom to work around these challenges without
incurring high legal costs and delays.
|
The most important substance in concrete is cement. Since the Roman days, cements of various make and quality have been known, but it wasn't until 1945 that I C Johnson made the first reliable Portland cement. Most cement today is hydraulic (water based) Portland, named after a place in south England where it was first quarried. Portland cement contains about 60% lime, 25% silica, and 5% alumina. Iron oxide and gypsum make up the rest of the materials. The gypsum regulates the setting, or hardening, time of cement. The lime comes from materials such as limestone, oyster shells, chalk, and a type of clay that is called marl. Shale, clay, silica sand, slate, and blast-furnace slag provide the silica and alumina. Iron oxide is supplied by iron ore, pyrite, and other materials. The production of strong cement is an involved process, subject to daily and seasonal variations and has been perfected to a high degree. Depending on its use, concrete is made from cement and water plus aggregates (broken stone plus sand), or other materials such as slate, slag and pumice to influence flexibility and weight. The strength of concrete depends on its weakest component. Concrete is tested as a standard cylinder, which is subjected to a crushing force, expressed in MegaPascals (MPa). Standard structural concrete has 20-25 MPa crushing strength. By comparison, atmospheric pressure is 0.1 MPA, and a dive cylinder is topped up to 20 MPa. Modern technology is capable of making concrete of 200 MPa crushing strength. In a concrete batching plant, the plant engineer designs concrete mixes to suit certain purposes. Design strength is important, but so are workability, air content, consistency and the ultimate finish. The most expensive component in concrete is cement, of which only the amount strictly necessary is used. Water is added to match the crystalline demand of the cement. When concrete hardens, no water should seep out. Regulating the amount of water is difficult since the sand contains a variable amount of it. All enclosed water should take part in growing cement crystals, long microscopic fingers (dendrites) growing into all spaces between aggregate grains, and locking these firmly in place. Too much or too little water weakens the mix. Pollution from mud and algae also weakens the mix. In the process of setting, heat is produced. Heat limits the size of a pour and the speed at which large pours are allowed to harden. Concrete is strongest in resisting compression (push), but weak in tension (pull), particularly because it cracks easily due to internal stresses. To make concrete more versatile, it is reinforced with steel mesh, which resists traction. Engineers take care that concrete is pressed and never stretched. In beams, the top part compresses whereas the bottom end stretches. To overcome this, steel rods are placed in the bottom part and prestressed (prestressed concrete). The following types of concrete are used:
|
|
Chemistry: When pure silica sand (SiO2) is heated above 1700ºC, it melts. When left to cool very, very slowly, it crystallises into quartz, a hard, very clear, resilient crystal with excellent optical qualities. Glass and quartz derive their stability and hardness from the formation of SiO4 tetrahedra (pyramid bonds), with connecting O-Si-O and Si-O-Si bonds. When cooled rather quickly, crystals can't form and fused silica glass is formed, remaining a 'super-cooled' liquid instead. Unlike solids, glass does not suddenly become liquid when heated, but becomes gradually more fluid. This is called an amorphous (L: a=not; morphe= form; shapeless) solid. Glasses can be made from various substances, but those made from silica sand are the most widely used. Like other silica compounds in the Earth's mantle, various oxides can be substituted for silicon oxide, resulting in glasses with varying properties:
Uses of glass: Glass is used extensively by society in a wide range of applications, like window glass, glazing for pottery, glassware, bottles, containers, lamps, television tubes, lenses, telescopes, mirrors, fibre glass reinforcement, lasers, insulators, semiconductors, stained glass, art and many more. Glass is strong in both tension and compression. Most commercial glass is stronger than concrete (14-170 MPa), but glass fibres have been produced, a hundred times stronger still. Unfortunately, glass is rather brittle and shatters easily. Glass manufacturing: Glass is made in batches of
one to several tonnes at a time. It requires a large amount of energy of
high quality to melt the mix, thus making the recycling of used glass
attractive. Traditionally, glass is hand-blown from the liquid batch, with
or without the use of forms. During production, and when left to cool,
glass products develop internal tensions that make them sensitive to mechanical
shock and temperature, but annealing, the re-heating and subsequent
slow cooling, remedies this (toughening). For car windows, the internal
tension is exacerbated by hardening through rapid cooling. Such glass shatters
in small fragments.
|
| Related
information
Statement of evidence of the consulting engineer for Kaipara Excavators (9 pages): www.seafriends.org.nz/oceano/kaipara.htm The Seafriends web site details the processes of nature and human intervention: www.seafriends.org.nz The physics and consequences of waves: www.seafriends.org.nz/oceano/waves.htm How beaches work: www.seafriends.org.nz/oceano/beach.htm. Why our beaches are disappearing: www.seafriends.org.nz/oceano/beachgo.htm. This article has been published on: www.seafriends.org.nz/oceano/seasand.htm Read more about rocks, sediment types: www.seafriends.org.nz/enviro/soil/rocktbl.htm - |
| References.
The reports and books marked blue, are available from the Seafriends Library.
Auckland Regional Council reports: Beach monitoring report for Long Bay, Muriwai and Piha. Tonkin & Taylor Ltd. 1998 Omaha beach profile data base. Tonkin & Taylor Ltd. 1998. Wave buoy deployment at the Mokohinau Islands: Data report. NIWA. 1999 |
For further information, refer to the libraries of the Auckland and Northland Regional Councils.
 The
behaviour of particles in water as researched by Heezen and Hollister (1964)
has produced the most important diagram above. It basically has a left-hand
curve for sedimentation and a right-hand curve for erosion. Horizontally
it shows water velocity and vertically particle size but the scales are
logarithmic. The straight line in the middle gives a square root relationship
meaning that a particle needs to be 100 times larger in diameter to sink
10 times faster, as is true for large particles. A widening gap exists
between the lefthand and the righthand curves, meaning that particles need
higher water velocities to erode, but once dislodged, need a much lower
water speed to settle out again. The righthand curve for erosion bends
forward for small particles like silt and clay, meaning that once these
have settled, much higher currents are needed to dislodge them again.
The
behaviour of particles in water as researched by Heezen and Hollister (1964)
has produced the most important diagram above. It basically has a left-hand
curve for sedimentation and a right-hand curve for erosion. Horizontally
it shows water velocity and vertically particle size but the scales are
logarithmic. The straight line in the middle gives a square root relationship
meaning that a particle needs to be 100 times larger in diameter to sink
10 times faster, as is true for large particles. A widening gap exists
between the lefthand and the righthand curves, meaning that particles need
higher water velocities to erode, but once dislodged, need a much lower
water speed to settle out again. The righthand curve for erosion bends
forward for small particles like silt and clay, meaning that once these
have settled, much higher currents are needed to dislodge them again.
 About
20 million years ago, the whole region from Whangarei in the north to Hamilton
in the south, was covered by an inland sea, the Waitemata Basin. This sea
was lined by a hardish basement rock, greywacke, which also constituted
the rim of the basin on the east side where Great Barrier Island is today,
and the north side near Whangarei. The western rim was lined with volcanoes.
The greywacke lining and borders belonged to a group known as the Waipapa
Group which possibly derived from the erosion products of the parent rocks
of old Gondwana of which Australia was a component. Its hardness was a
result of compression and heating.
About
20 million years ago, the whole region from Whangarei in the north to Hamilton
in the south, was covered by an inland sea, the Waitemata Basin. This sea
was lined by a hardish basement rock, greywacke, which also constituted
the rim of the basin on the east side where Great Barrier Island is today,
and the north side near Whangarei. The western rim was lined with volcanoes.
The greywacke lining and borders belonged to a group known as the Waipapa
Group which possibly derived from the erosion products of the parent rocks
of old Gondwana of which Australia was a component. Its hardness was a
result of compression and heating.