how CO2 benefits plants and ecosystems By Dr J Floor Anthoni (2010)
www.seafriends.org.nz/issues/global/climate5.htm
(This chapter is best navigated by opening links in a new tab of your
browser)
Without any doubt, the rising levels of CO2
in air have benefited plant life, and thus animal life and people. This
chapter studies the ecology of carbon and plants, and where carbon is located
in the world's ecosystems. In order to understand scientific studies of
CO2-enriched plant growth, one must also know their limitations. Finally
some examples are given of the evidence provided by hundreds of studies.
A refresher of some basic plant ecology: where the carbon is found;
the main ecosystems of the world with their carbon stores above and under
ground; the basic plant types and their reactions to increased carbondioxide
concentrations.
sea water: the elements
in sea water and what they mean to life.
external links
http://co2science.org/
a web site devoted to the study of the effect of CO2 on plant life, complete
with extensive scientific data of many plant species. The evidence is overwhelming:
more CO2 means more life. This web site is highly recommended for further
studies.
Introduction The huge propaganda aimed at making carbondioxide the main villain
of global warming, threatening humanity's future and prosperity,
is now believed by a majority of people. Carbondioxide is now pollution,
on a par with oil slicks and industrial poisons. But nothing could be further
from the truth, as CO2 is the life-bearing gas on which all life depends.
How could society deceive itself to such extent?
The benefits from CO2 are not even mentioned in the IPCC assessment reports.
In this polarised world of warmists and skeptics, warmists
sometimes acknowledge that "CO2 may have some effect on plant growth,
but never long-lasting." Yet scientific experiments, now on-going for
over two decades, tell a different story: all plants react very favourably
to CO2-fertilisation, and some more so than others.
In this chapter we will put some misunderstandings to rest, beginning
by reviewing the ecology of carbon and how it recycles. Then we'll study
where the carbon is found in ecosystems and how these ecosystems acquired
it. Before reviewing some important findings, we'll review how scientific
experiments are done and learn about their limitations.
On the Seafriends website we have quite extensively documented the geology,
ecology and biology of soil and the world's ecosystems (see soil)
in order to foster a thorough understanding necessary for combating soil
loss (in quality and quantity), the world's foremost ecological problem.
This educational resource now also serves to understand an important side
of 'global warming'.
We are happy and fortunate that somewhere else exists a web site specialising
in the science of CO2 fertilisation, complete with extensive data for many
plant species. It is also scientifically independent and objective. So
please continue your studies at www.co2science.org.
Carbon ecology Carbondioxide is food for plants, like nothing else. While making live
tissues through photosynthesis, they combine carbondioxide with water,
simplistically as::
6CO2 + 6H2O + Light => C6H12O6 (Glucose) + 6O2 or more simply
CO2 + H2O => CH2O + O2
For making more complicated biochemical substances like proteins, also
minerals are required like nitrogen (N), potassium (K), sulfur
(S) and some twenty more. See the elements
of life. But CO2 and water remain the most important ones. Of these
two, water is the most abundant substance whereas CO2 the least abundant,
by far. For instance, in the air around us, only one in 3000 molecules
is CO2, and plants must be able to catch these, in competition with all
other plants on Earth. No surprise then that CO2 is highly in demand, and
higher concentrations of it promote plant growth like nothing else.
To
understand that plants live in a world where CO2 is scarce, these two diagrams
provide an ecological explanation. The green S-curve is how a population
grows in relation to its resources like food. First (on left), their world
is unexploited and food is plentiful. so the population grows explosively
(exponentially) until mid-way growth slows down as food becomes more scarce.
As the population grows further, growth slows to a trickle until it stops
for lack of food. If such a population is a warm-blooded species, the maximum
population cannot reach the top of the curve because such species require
much food to survive. However, cold-blooded species can survive better
in the almost fully exploited world, and 'cold-blooded' species that do
not even move, like plants, can survive and still grow in the grey band
of an almost fully exploited resource.
Remember that CO2 is the only resource in the world that is evenly spread
and can be accessed anywhere to the same extent. So it is also the only
'global' resource that is competed for by each and every plant on Earth.
The red graph shows growth rate (horizontal) as a function of the use
of the resource (vertical). One can see that in the grey band, the growth
rate is severely limited by the scarcity of the resource. Move the black
arrow slightly down, and a large increase in growth rate follows. This
is again depicted in the diagram shown here.
The
green curve in this diagram is in fact the same red curve of previous diagram,
but now rotated such that the resource is now horizontal and growth vertical.
It is expected that a relatively small increase in the concentration of
CO2 in air, results in an enthusiastic response in growth rate. But experiments
show varying results, even though all are positive. Why?
Firstly, each species responds differently to CO2 and their condition
also depends heavily on other factors like temperature, moisture, competition
for space, root competition, nutrients and quality of the soil. So it is
practically impossible to mimic the natural situation in experiments.
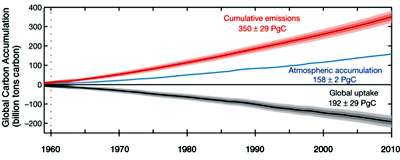
The amount of fossil fuel burnt by humans has been increasing exponentially,
which means that annual emissions have been growing, and 57% of that is
consistently retained in air.
Does sequestration by
plants keep up with human emissions? we've
seen overwhelming evidence that plants sequester only 43% of human emissions,
which was confirmed by a recent study of Ballantyne et al [1] who plotted
the missing CO2 against total emissions. Their diagram shows CO2 emissions
in red and plant sequestrations in black. Although plants capture only
about half of increased emissions, they are doing so ever more progressively.
Indeed, in the past 50 years, their uptake has even doubled rather than
levelled off as was feared by warmists.
[1] Ballantyne A P et al
(2012): Increase in net carbon dioxide uptake by land and oceans during
the past 50 years, Nature 488, 70-72.
The
Carbon
Pipe concept We've shown before that the idea of carbon reservoirs is perhaps inaccurate,
and that carbon flows more like inside a pipe, where the flow is
determined by pressure (concentration in air). One cannot talk about carbondioxide
without looking at the full picture with all its pathways, and much of
this remains unknown. Plants absorb the CO2 breathed out by animals (not
much) and from decomposition (much). Most of this interchange happens nearby,
in fact on the roots of land plants, and likewise for plankton. Thus carbondioxide
cycles fastest outside the atmosphere.
The imaginary carbon pipe also connects the land with the sea
in such a way that during warm interglacials, carbon travels from sea to
land and during the cold ice ages in the opposite direction.
In the discourse about CO2, never forget these two images, showing world
vegetation during an ice age (right) and warm interglacial (left). The
difference is ENORMOUS. The world as we know it today, is rich with vegetation
and life, and its soils are also rich in carbon. All that carbon came from
the sea, through the imaginary carbon pipe discussed above.
Thus the main movement of carbondioxide happens as follows:
global warming => oceans expel CO2 => higher CO2 in air
=> CO2 absorbed by plants and soil
and the man-made CO2 is just part of this very large shift in fertility.
Let's just hope that it continues for a few more millennia, rather than
reversing into the next ice age. The first thing to notice could well be
a lowering of the CO2 concentration in the atmosphere. From there on, the
world rapidly descends back into poverty and cold. In an ice age, life
is brutal and short.
Plant ecology The world is large and has many climate zones, each with its own type
of vegetation and type of soil. In order to understand where land plants
will sequester the additional anthropogenic carbondioxide, one must understand
some basic plant ecology.
Where is the carbon found? The
diagram shows where the carbon is found on land. If we take one metre squared,
then the air above it contains a mass of 10,000kg = 10 tonnes. CO2 makes
up 3kg = 1kg Carbon. Above the soil stand forests 15kgC, grass 3kgC and
their grazers 0.05kgC. The predators make up an even smaller carbon weight.
Under the surface extends the soil, of which only the top soil is rich
in carbon. 10cm topsoil weighs about 200kg and the microfauna alone weighs
10kgC, very much more than the grazers above it. In addition to this there
are roots, leaf litter and humus which could weigh as much as the vegetation
above.
This
rather complicated diagram brings together the main types of world vegetation
(colours), their extents (vertical scale), their biomass above and under
the ground (left columns; soil leftmost; canopy rightmost), and their productivities
(righthand column). The quantities are expressed in petagram PgC which
is identical to gigaton GtC. It can be seen that some ecosystems store
more carbon underground than above (tundra, taiga, grassland), whereas
others store more above than below (conifers, humid broad-leaved forests).
Amazingly, their productivities are roughly equal once temperature suffices
(tundra is too cold). The humid broad-leaved forest is the tropical rainforest,
which eclipses all others.
Finally,
to show where the world's ecosystems are found, together with their soils,
this diagram brings together the climate variables of temperature, rainfall
and potential evapotranspiration. Starting from the left in the Arctic,
the tundra's growth is severely hindered by permafrost. But as one goes
southward, the temperature (red curve) rises quickly to allow for productivity
in the taiga boreal forests. It crosses the rainfall curve (blue) where
soils are deepest and agricultural productivity highest. This is also the
most sustainable area on the planet. But from here on, rainfall quickly
becomes insufficient for evapotranspiration, resulting first in dry grasslands
(steppe) and then the desert. In desert soils, rainfall is even insufficient
to wash out calcium compounds and other salts, which results in strata
('horizons') of salts, limestone and gypsum.
One can see that the soil depth keeps up with productivity until it becomes
thickest in the black cernozem, before thinning out through the
steppe grasslands towards the desert. One can also see the ground water
table dipping accordingly. It must be noted that the most productive ecosystems
are found where evapotranspiration equals rainfall, a relatively small
band across the planet. Not surprisingly, these areas are heavily farmed.
It can be expected that these areas benefit most from CO2 fertilisation.
C3 and C4 plants Not all plants react equally to enriched CO2. The old plants which
stem from the age of dinosaurs (cycads, ferns, horse-tails) evolved in
an age rich in CO2, and they are now severely stunted in their growth rates.
Not surprisingly, they react most enthusiastically.
Later came the conifers, now found naturally in the very cold regions
of the boreal forests. They too react well.
Then came the leafy trees, shrubs and weeds with their wide leaves optimised
for photosynthesis, together with their ability to drop leaves in response
to frost or drought. All of these are powered by the C3 photosynthesis,
which consists of three biochemical steps. They too react well.
Then arrived the most recent grasses (maize, sorghum, sugarcane, bamboo)
powered by a new method of photosynthesis, the C4 process which
happens in 4 steps, and which is able to capture CO2 more efficiently.
They are about twice as efficient in converting sunlight, while needing
four times less water. Photosynthesis in C3 plants converts 0.1-0.4 g CO2
with 1 kg water, whereas C4 plants convert 0.4-0.8 gram. However, a higher
temperature is also needed. Thus C4 plants are found mainly in warm areas,
even though plant breeding has extended their temperature range. Not surprisingly,
they do not react as well, because they are already better than others
at capturing CO2.
To complete the list, there are also plants powered by the Crassulean
Acid MetabolismCAM photosynthesis (cacti, succulents, agaves,
lilies, bromeliads, orchids, euphorbia, geraniums) which enables them to
store CO2 at night for delayed photosynthesis by day. In this manner they
can close their water pores during the day, while opening up at night.
Such plants grow rather slowly but resist dry climates.
During the night, CO2 is absorbed and converted into chemical storage
as oxaloacetic acid and then as malate. During the day, these compounds
are converted and normal C3 photosynthesis takes place, with the
plant's leaf pores closed to prevent unnecessary evaporation. They use
a minimum of water.
Scientific experiments "Watching grass grow" is an expression of impatience with a slow but
steady process. Plant growth is indeed very slow, which means that plants
cannot react immediately to an increased supply of CO2. They need to grow
more leaves and roots, process more water such that next year they can
do the same and perhaps a little more. But in doing so, they also produce
more leaf litter, insects and other animals that eat their leaves, and
all this must be recycled by the soil, which needs more bacterial activity,
and so on. Thus keeping up with an ever increasing flow of CO2 is hampered
by delays. It is therefore important to recognise how scientists do their
CO2-enrichment experiments.
But before we do so, a general comment of disenchantment. All these
experiments look only at INCREASED carbondioxide levels, and NONE have
looked at DECREASED levels, which is entirely unscientific. Thus ALL carbondioxide
enrichment experiments so far are POLITICALLY or INDUSTRIALLY driven. Real
science would have studied the whole gamut (reach) of CO2.
We can now split plant growth experiments into separate categories:
hydroponic glasshouse: plants are grown in water, rich in nutrients.
Inside a glasshouse the concentration of CO2 is enriched. This now has
become common practice for growing vegetables and flowers at optimal productivity,
but it does not reflect the real-world situation because of:
a higher temperature which is not found outside the glasshouse, even when
control plants are kept inside the same situation.
nutrients and water are available in unlimited quantities.
there is no soil and no recycling
plants in pots: plants are grown in pots, inside enclosures to maintain
the required CO2 concentrations.
the temperature argument remains, as above
pots run out of nutrients unless re-fertilised during the experiment.
plants run out of root space, so these experiments are valid for one year
only at most.
there is no recycling in the small amount of soil
there is plenty of water and moisture
sample plots outside: plants are grown in soil outside, for one
or more years. It reflects the real-world situation much better, even though
enclosures affect temperature. If the plots are not re-fertilised and watered,
the situation becomes even more natural. However, very few experiments
do this. Most grow the crop for only one season.
resembling more the natural situation: nutrients, root space, recycling.
the experiment can run for several decades.
these experiments are rare
some commercial plots like grassland, are overfertilised and have depleted
soil functionality.
real ecosystems: scientists observe how the real world reacts as
time proceeds and carbondioxide levels increase. With satellites the surface
areas of various biotopes (forest, grass, desert) can be measured. Also
the amount of chlorophyll, representing leaf volume, can be measured. The
real ecosystems react more slowly because:
other factors play a role: availability of moisture, warmth, nutrients;
competition for space and light, and so on.
there is no space to grow sideways - only upwards. But in some ecosystems
density can still increase (grass, chaparral)
soil, soil organisms and soil carbon must also increase.
algal growth studies: scientists can cause fraudulent results by
adding acid rather than CO2. Even when bubbling CO2 through the sample,
it lowers the pH which by itself promotes algal growth. Seawater is saturated
in CO2.
This
graph shows the results of one of the few experiments carried out over
a long time period, with sour orange trees at ambient CO2 and enriched
by +300ppm. The trees growing in nearly twice the concentration, consistently
outperform the controls at ambient CO2 by almost 100%, particularly towards
the end of the series. The graph does little justice to the visual side
of the experiment, because if one increases its wood consistently twice
each year, the difference with their controls becomes very large over time.
Location: Maricopa, Arizona.
Paradoxically, the authors state that "Carbon dioxide fertilization
increases plant water use efficiency, which may help explain why the desert
ecosystems responded more dramatically than other ecosystems." http://ag.arizona.edu/pubs/natresources/az1395.pdf
The plant growth experiments unanimously agree that:
all plants grow better in higher CO2 concentrations
they photosynthesise better, in other words, they are more productive,
making food more quickly
they produce more biomass, in other words more wood, roots and biomatter
for recycling
as they grow faster, the amount of protein produced, is slightly
less per unit of biomass. Some say that the quality of the food
becomes slightly less. More carbohydrates, but with somewhat less protein.
plants appear to need less water or to resist drought better, which
is important for the vast marginal croplands.
As CO2 is linked to temperature, this could lead to the following advantages:
extended seasons: crops will ripen more quickly; there is less of
a risk to crop failures; double cropping can happen over larger areas.
extended range: one would be able to grow crops belonging to warmer
regions.
growing faster: growing world populations need more harvest from
less soil.
more bulk: in some crops, bulk is more important than foliage (firewood,
timber).
more carbon in soils: there will be more leaf litter and roots to
feed the soil biota.
more microbial life: more soil biota implies deeper soil, better
water holding capability and faster recycling.
less water required: water is the next world problem and if crops
can do with less, so much the better.
more drought resistant: although this is only of little benefit,
it does make marginal cropping less marginal.
increased tolerance for low light levels: more growth for sub-canopy
(understorey) species.
less erosion: loss of soil quality and quantity is one of the world's
biggest problems, and higher CO2 concentrations help combat it.
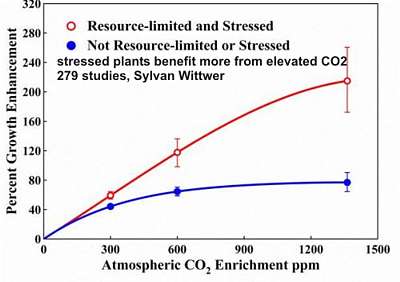
Whereas
plants cultivated in optimum conditions benefit substantially from elevated
levels of CO2 (blue curve), an overwhelming number of studies have shown
that stressed plants which are limited in one or more resources (water,
temperature, nutrients, light, herbicides, etc), benefit even more so (red
curve). Their growth rates indeed double for a doubling in CO2. Reader
please note that this is paradoxical because CO2 effects on growth do not
simply follow Liebigs law of the minimum (Walter Larcher), and that these
studies confirm our exponential growth
paradigm above. What this means, is that elevated levels of CO2 have proved
to be extremely beneficial for the world. "Increasing atmospheric CO2 is
an unmixed blessing it will bring currently unproductive land into use
and bring greater yield from existing land without additional fertilizer
use. This is a wonderful benefit in being able to feed an increasing world
population."
There has been and still remains, a
great reluctance on the part of many climatologists and ecologists, and
especially environmentalists, to accept the concept that the rising level
of atmospheric CO2 could be more beneficial than harmful for plant growth,
food production, and the overall biosphere Yet the scientific evidence
is overwhelming. - Sylvan Wittwer
Evidence From various sources we have selected the growth responses of the most
important plant species, all in terms of biomass. These results give a
good idea of what to expect from certain ecosystems, and what carbondioxide
fertilisation means for food.
ancient species Sago Palm Cycas revoluta Water Fern Azolla pinnata Fern, Tropical Pyrrosia piloselloides .
+300ppm enriched +172%
+54%
+78%
.
comments .
+90% at +600ppm
.
.
conifer species European larch Larix decidua Douglas Fir Pseudotsuga menziesii Spruce various Picea spp Pine various Pinus spp
+300ppm enriched +140%
+10%
+38%
+22 to +38%
comments .
.
no reaction to higher CO2
P.eldarica +150%; P.mercus +200%
broadleaf tree species (C3) Various Acacia spp Aspen Populus spp Beech Fagus spp Birch Betula spp Gum trees Eucalyptus spp Ash species Fraxinus spp Tropical Savanna Tree Kielmeyera coriacea Maple various Acer spp Oak various Quercus spp
+300ppm enriched +71 to +100%
+29 to 58%
+24 to +88%
+15 to 34%
+46 to 130%
+13 to 33%
+88%
+30 to +95%
+38 to 110%
comments .
.
American beech responds better
.
.
.
.
.
large variation between species
grain species (C3) Oats Avene spp Barley Hordeum vulgare Rice Oryza sativa Common Wheat Triticum aestivum
+300ppm enriched +23 to +33%
+38%
+34%
+32%
comments .
.
+141% at +600ppm. Most important food crop
reacts little to higher CO2
C4 grasses species various permanent grassland species
Johnsongrass Sorghum halepense Sugarcane Saccharum officinarum Corn Zea mays
+300ppm enriched +20 to +65%
0 to +13%
+34%
+21%
comments .
reacts poorly
.
33% at +600ppm
fruit species orange trees Citrus spp Grapevine, Common Vitis vinifera Olive Tree Olea europaea Peach Tree Prunus persica
+300ppm enriched +60%
+50 to 70%
+28 to 56%
+50%
+47%
+18%
+60%
+150%
comments .
do not respond to higher CO2
do not respond to higher CO2
.
+61% at +900ppm
+115% at +900ppm
.
+53% at +600ppm!
root crop species Carrot Daucus carota Cassava Manihot spp Sweet Potato Ipomoea batatas Potato, White Solanum tuberosum
+300ppm enriched +78%
+88%
+33%
+30%
comments .
.
+148% at +600ppm!!
+71% at +900ppm
desert species various Agave spp .
+300ppm enriched +30 to +35%
.
comments .
.
Most annual 'weeds' react vigorously, up to +460%. Weeds are species
that grow fast, reproduce profusely but live short lives.
Most human food crops react very positively, a huge benefit for growing
populations.
Water Fern Azolla pinnata +54%. Reacts vigorously to higher
concentrations. Azolla is an important fertiliser of rice paddies.
White Clover Trifolium repens +65%. An important fertiliser
of grasslands.
Water Hyacinth, Common Eichhornia crassipes +50%. A pest growing
in waterways.
Wild Spikenard Hyptis suaveolens +1700%. The winner? Pignut
or bushmint, a tropical noxious plant with antibacterial properties.
In glasshouses, flowers are grown in very high CO2 concentrations of
+900ppm, with medium response.
Satellite observations
of plant growth It
is still a bit early to detect plant growth from satellite observations,
but here is an early result. The colour scale was chosen such that yellow
means no additional growth, whereas green to purple signify an increase
in growth. As can be expected, the very cold and very dry areas did not
respond and the tropical forests reacted most (the authors warn that extra
rain could have caused this). Leaving those two areas aside, it looks like
half of the green world has increased productivity by 1% per year. Would
this mean 40% in 40 years or 40 GtC? That would be close to the missing
CO2 of 60GtC. The future will tell.
Various notes Finally various notes as a 'rats and mice' selection.
From the literature Hundreds of studies and
extensive research conclusively show the link between CO2 levels and plant
growth. Using a conservative estimate for the range of the recent atmosphere,
for every 10 ppm (parts per million) that CO2 increases, plant growth increases
roughly 1%. This varies from species to species and with other conditions/nutrients
needed for growth. With CO2 levels rising from 280 ppm to 390 ppm
(+110 ppm) since the Industrial Revolution, this equates to an 11% increase
in plant growth.
[Note. Since the beginning
of the Green Revolution (1960), CO2 increased by 60ppm, accounting
for 6% increase in plant growth and crop productivity. It could well be
that new crops, more fertilisation and more irrigation did little compared
to the concurrent increase in CO2]
The carbon:nitrogen ratio
of leaves of plants is usually increased under CO2 enrichment. Plants may
acclimate to elevated CO2 by requiring less rubisco and photo-synthetic
apparatus, which would lead to lower nitrogen contents. The overall change
in C:N ratios is governed both by increases in structural and non-structural
carbohydrates, and by decreases in protein content. However, seed nitrogen
content is little affected (Allen et al., 1988).
Water-use efficiency (WUE)
(ratio of CO2 uptake to evapotranspiration) will increase under higher
CO2 conditions. This increase is caused more by increased photosynthesis
than it is by a reduction of water loss through partially closed stomata.
Thus, more biomass can be produced per unit of water used, although a crop
would still require almost as much water from sowing to final harvest.
If temperatures rise, however, the increased WUE caused by the CO2 fertilization
effect could be diminished or negated, unless planting dates can be changed
to more favourable seasons.
The direct effect of increasing
temperatures across the range of 28 to 35°C appears to increase transpiration
rate about 4 to 5% per °C, based on both experimental and modelling
studies (Allen, 1991). This is in close agreement with the rise in saturation
vapour pressure of about 6% per °C. Allen et al. (1985)
Cow-madness
in New Zealand New Zealand has an unusually
large agricultural sector with pastoral (grass) farming. Since the global
warming scare, it was discovered that cows belch (burp, exhale) methane
while chewing their cud, and that since methane is a "twenty times more
potent greenhouse gas", this must be combated and compensated for in New
Zealand's carbon footprint.
NIWA (National Institute
for Water and Atmosphere) explains it as follows [1]: Why is farming
not carbon-neutral or carbon-negative? After all, cows eat grass made from
CO2, defecate some of it, and produce milk and meat which is exported.
They are thus a sink for CO2 and agriculture should be carbon-negative. Not so, because while
digesting grass, cows produce some methane (CH4), and although this was
made from CO2, a cow produces enough of this gas to power a car for 4km
every day! Since methane is a 21 times more potent greenhouse gas (false),
our cows and sheep are the source of 47% of all NZ's greenhouse gas emissions
(also
false). Methane
acts as a blanket in the atmosphere, absorbing infrared rays as they radiate
off the earth and bouncing some of them back down to re-heat it. In that
way it traps heat like all greenhouse gases, but methane is more efficient
than CO2 at absorbing infrared rays. On top of that, it spends an average
of nine years in the atmosphere before it is oxidised back into CO2.
See how deep the global warming
madness has rooted itself? These are the words of scientists, intent on
wreaking the NZ economy for no benefit whatsoever. Guess what our children
are learning at school? When will common sense begin?
[1] Water & Atmosphere,
July 2010. "Why isn't grass in, methane out, carbon neutral?"
For extensive documentation of scientific articles and experimental
data, please refer to the excellent and objective web site co2science.org.
 To
understand that plants live in a world where CO2 is scarce, these two diagrams
provide an ecological explanation. The green S-curve is how a population
grows in relation to its resources like food. First (on left), their world
is unexploited and food is plentiful. so the population grows explosively
(exponentially) until mid-way growth slows down as food becomes more scarce.
As the population grows further, growth slows to a trickle until it stops
for lack of food. If such a population is a warm-blooded species, the maximum
population cannot reach the top of the curve because such species require
much food to survive. However, cold-blooded species can survive better
in the almost fully exploited world, and 'cold-blooded' species that do
not even move, like plants, can survive and still grow in the grey band
of an almost fully exploited resource.
To
understand that plants live in a world where CO2 is scarce, these two diagrams
provide an ecological explanation. The green S-curve is how a population
grows in relation to its resources like food. First (on left), their world
is unexploited and food is plentiful. so the population grows explosively
(exponentially) until mid-way growth slows down as food becomes more scarce.
As the population grows further, growth slows to a trickle until it stops
for lack of food. If such a population is a warm-blooded species, the maximum
population cannot reach the top of the curve because such species require
much food to survive. However, cold-blooded species can survive better
in the almost fully exploited world, and 'cold-blooded' species that do
not even move, like plants, can survive and still grow in the grey band
of an almost fully exploited resource. The
green curve in this diagram is in fact the same red curve of previous diagram,
but now rotated such that the resource is now horizontal and growth vertical.
It is expected that a relatively small increase in the concentration of
CO2 in air, results in an enthusiastic response in growth rate. But experiments
show varying results, even though all are positive. Why?
The
green curve in this diagram is in fact the same red curve of previous diagram,
but now rotated such that the resource is now horizontal and growth vertical.
It is expected that a relatively small increase in the concentration of
CO2 in air, results in an enthusiastic response in growth rate. But experiments
show varying results, even though all are positive. Why?
 we've
seen overwhelming evidence that plants sequester only 43% of human emissions,
which was confirmed by a recent study of Ballantyne et al [1] who plotted
the missing CO2 against total emissions. Their diagram shows CO2 emissions
in red and plant sequestrations in black. Although plants capture only
about half of increased emissions, they are doing so ever more progressively.
Indeed, in the past 50 years, their uptake has even doubled rather than
levelled off as was feared by warmists.
we've
seen overwhelming evidence that plants sequester only 43% of human emissions,
which was confirmed by a recent study of Ballantyne et al [1] who plotted
the missing CO2 against total emissions. Their diagram shows CO2 emissions
in red and plant sequestrations in black. Although plants capture only
about half of increased emissions, they are doing so ever more progressively.
Indeed, in the past 50 years, their uptake has even doubled rather than
levelled off as was feared by warmists.
 The
Carbon
Pipe concept
The
Carbon
Pipe concept
 The
diagram shows where the carbon is found on land. If we take one metre squared,
then the air above it contains a mass of 10,000kg = 10 tonnes. CO2 makes
up 3kg = 1kg Carbon. Above the soil stand forests 15kgC, grass 3kgC and
their grazers 0.05kgC. The predators make up an even smaller carbon weight.
Under the surface extends the soil, of which only the top soil is rich
in carbon. 10cm topsoil weighs about 200kg and the microfauna alone weighs
10kgC, very much more than the grazers above it. In addition to this there
are roots, leaf litter and humus which could weigh as much as the vegetation
above.
The
diagram shows where the carbon is found on land. If we take one metre squared,
then the air above it contains a mass of 10,000kg = 10 tonnes. CO2 makes
up 3kg = 1kg Carbon. Above the soil stand forests 15kgC, grass 3kgC and
their grazers 0.05kgC. The predators make up an even smaller carbon weight.
Under the surface extends the soil, of which only the top soil is rich
in carbon. 10cm topsoil weighs about 200kg and the microfauna alone weighs
10kgC, very much more than the grazers above it. In addition to this there
are roots, leaf litter and humus which could weigh as much as the vegetation
above. This
rather complicated diagram brings together the main types of world vegetation
(colours), their extents (vertical scale), their biomass above and under
the ground (left columns; soil leftmost; canopy rightmost), and their productivities
(righthand column). The quantities are expressed in petagram PgC which
is identical to gigaton GtC. It can be seen that some ecosystems store
more carbon underground than above (tundra, taiga, grassland), whereas
others store more above than below (conifers, humid broad-leaved forests).
Amazingly, their productivities are roughly equal once temperature suffices
(tundra is too cold). The humid broad-leaved forest is the tropical rainforest,
which eclipses all others.
This
rather complicated diagram brings together the main types of world vegetation
(colours), their extents (vertical scale), their biomass above and under
the ground (left columns; soil leftmost; canopy rightmost), and their productivities
(righthand column). The quantities are expressed in petagram PgC which
is identical to gigaton GtC. It can be seen that some ecosystems store
more carbon underground than above (tundra, taiga, grassland), whereas
others store more above than below (conifers, humid broad-leaved forests).
Amazingly, their productivities are roughly equal once temperature suffices
(tundra is too cold). The humid broad-leaved forest is the tropical rainforest,
which eclipses all others. Finally,
to show where the world's ecosystems are found, together with their soils,
this diagram brings together the climate variables of temperature, rainfall
and potential evapotranspiration. Starting from the left in the Arctic,
the tundra's growth is severely hindered by permafrost. But as one goes
southward, the temperature (red curve) rises quickly to allow for productivity
in the taiga boreal forests. It crosses the rainfall curve (blue) where
soils are deepest and agricultural productivity highest. This is also the
most sustainable area on the planet. But from here on, rainfall quickly
becomes insufficient for evapotranspiration, resulting first in dry grasslands
(steppe) and then the desert. In desert soils, rainfall is even insufficient
to wash out calcium compounds and other salts, which results in strata
('horizons') of salts, limestone and gypsum.
Finally,
to show where the world's ecosystems are found, together with their soils,
this diagram brings together the climate variables of temperature, rainfall
and potential evapotranspiration. Starting from the left in the Arctic,
the tundra's growth is severely hindered by permafrost. But as one goes
southward, the temperature (red curve) rises quickly to allow for productivity
in the taiga boreal forests. It crosses the rainfall curve (blue) where
soils are deepest and agricultural productivity highest. This is also the
most sustainable area on the planet. But from here on, rainfall quickly
becomes insufficient for evapotranspiration, resulting first in dry grasslands
(steppe) and then the desert. In desert soils, rainfall is even insufficient
to wash out calcium compounds and other salts, which results in strata
('horizons') of salts, limestone and gypsum. This
graph shows the results of one of the few experiments carried out over
a long time period, with sour orange trees at ambient CO2 and enriched
by +300ppm. The trees growing in nearly twice the concentration, consistently
outperform the controls at ambient CO2 by almost 100%, particularly towards
the end of the series. The graph does little justice to the visual side
of the experiment, because if one increases its wood consistently twice
each year, the difference with their controls becomes very large over time.
Location: Maricopa, Arizona.
This
graph shows the results of one of the few experiments carried out over
a long time period, with sour orange trees at ambient CO2 and enriched
by +300ppm. The trees growing in nearly twice the concentration, consistently
outperform the controls at ambient CO2 by almost 100%, particularly towards
the end of the series. The graph does little justice to the visual side
of the experiment, because if one increases its wood consistently twice
each year, the difference with their controls becomes very large over time.
Location: Maricopa, Arizona.
 Whereas
plants cultivated in optimum conditions benefit substantially from elevated
levels of CO2 (blue curve), an overwhelming number of studies have shown
that stressed plants which are limited in one or more resources (water,
temperature, nutrients, light, herbicides, etc), benefit even more so (red
curve). Their growth rates indeed double for a doubling in CO2. Reader
please note that this is paradoxical because CO2 effects on growth do not
simply follow Liebigs law of the minimum (Walter Larcher), and that these
studies confirm our
Whereas
plants cultivated in optimum conditions benefit substantially from elevated
levels of CO2 (blue curve), an overwhelming number of studies have shown
that stressed plants which are limited in one or more resources (water,
temperature, nutrients, light, herbicides, etc), benefit even more so (red
curve). Their growth rates indeed double for a doubling in CO2. Reader
please note that this is paradoxical because CO2 effects on growth do not
simply follow Liebigs law of the minimum (Walter Larcher), and that these
studies confirm our 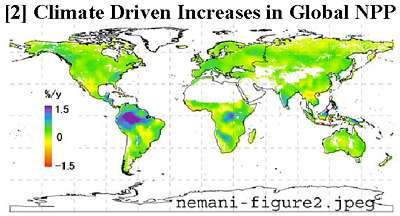 It
is still a bit early to detect plant growth from satellite observations,
but here is an early result. The colour scale was chosen such that yellow
means no additional growth, whereas green to purple signify an increase
in growth. As can be expected, the very cold and very dry areas did not
respond and the tropical forests reacted most (the authors warn that extra
rain could have caused this). Leaving those two areas aside, it looks like
half of the green world has increased productivity by 1% per year. Would
this mean 40% in 40 years or 40 GtC? That would be close to the missing
CO2 of 60GtC. The future will tell.
It
is still a bit early to detect plant growth from satellite observations,
but here is an early result. The colour scale was chosen such that yellow
means no additional growth, whereas green to purple signify an increase
in growth. As can be expected, the very cold and very dry areas did not
respond and the tropical forests reacted most (the authors warn that extra
rain could have caused this). Leaving those two areas aside, it looks like
half of the green world has increased productivity by 1% per year. Would
this mean 40% in 40 years or 40 GtC? That would be close to the missing
CO2 of 60GtC. The future will tell.