By Dr J Floor Anthoni (2000, 2006)
www.seafriends.org.nz/oceano/seawater.htm
(best viewed in a window as wide as a page. Open links in a new tab.)
In order to understand the sea, some of its
chemical properties are important. This page details the chemical composition
of sea water, salinity, density, its dissolved gases, carbon dioxide and
pH as limiting factor. Chemical elements in sea water do not exist on their
own but are attracted to preferential ions of opposite charge: sulphur
will occur mainly as sulphate, sodium as sodium chloride, and so on.
Helium He
Lithium Li
Beryllium Be
Boron B
Carbon C
Nitrogen ion
Fluorine F
Neon Ne
Aluminium Al
Silicon Si
Phosphorus P
Argon Ar
Scandium Sc
Titanium Ti
Vanadium V
Chromium Cr
Manganese Mn
Ferrum (Iron) Fe
Cobalt Co
Nickel Ni
Tellurium Te
Iodine I
Xenon Xe
Cesium Cs
Barium Ba
Lanthanum La
Cerium Ce
Praesodymium Pr
Neodymium Nd
Samarium Sm
Europium Eu
Gadolinium Gd
Terbium Tb
Dysprosium Dy
Holmium Ho
Erbium Er
Thulium Tm
Ytterbium Yb
Lutetium Lu
Hafnium Hf
Tantalum Ta
Tungsten W
Rhenium Re
Osmium Os
Iridium Ir
Platinum Pt
Aurum (gold) Au
Mercury Hg
Thallium Tl
Lead Pb
Bismuth Bi
Thorium Th
Uranium U
Plutonimu Pu
Note! ppm= parts per million = mg/litre
= 0.001g/kg.
source: Karl K Turekian:
Oceans.
1968. Prentice-Hall
Salinity and the main salt ions The salinity of sea water (usually 3.5%) is made up by all the dissolved
salts shown in the above table. Interestingly, their proportions are always
the same, which can be understood if salinity differences are caused by
either evaporating fresh water or adding fresh water from rivers. Freezing
and thawing also matter.
Salinity affects marine organisms because the process of osmosis transports
water towards a higher concentration through cell walls. A fish with a
cellular salinity of 1.8% will swell in fresh water and dehydrate in salt
water. So, saltwater fish drink water copiously while excreting excess
salts through their gills. Freshwater fish do the opposite by not drinking
but excreting copious amounts of urine while losing little of their body
salts.
Marine plants (seaweeds) and many lower organisms have no mechanism
to control osmosis, which makes them very sensitive to the salinity of
the water in which they live.
The main nutrients for plant growth are nitrogen (N as in nitrate NO3-,
nitrite NO2-, ammonia NH4+), phosporus (P as phosphate
PO43-) and potassium (K) followed by Sulfur (S), Magnesium (Mg)
and Calcium (Ca). Iron (Fe) is an essential component of enzymes and is
copiously available in soil, but not in sea water (0.0034ppm). This makes
iron an essential nutrient for plankton growth. Plankton organisms (like
diatoms) that make shells of silicon compounds furthermore need dissolved
silicon salts (SiO2) which at 3ppm can be rather limiting.
The main salt ions that make up 99.9% are the following:
chemical ion
valence
concentration
ppm, mg/kg
part of
salinity %
molecular
weight
mmol/
kg
Chloride Cl
-1
19345
55.03
35.453
546
Sodium Na
+1
10752
30.59
22.990
468
Sulfate SO4
-2
2701
7.68
96.062
28.1
Magnesium Mg
+2
1295
3.68
24.305
53.3
Calcium Ca
+2
416
1.18
40.078
10.4
Potassium K
+1
390
1.11
39.098
9.97
Bicarbonate HCO3
-1
145
0.41
61.016
2.34
Bromide Br
-1
66
0.19
79.904
0.83
Borate BO3
-3
27
0.08
58.808
0.46
Strontium Sr
+2
13
0.04
87.620
0.091
Fluoride F
-1
1
0.003
18.998
0.068
By adding the µmol in last column up, multiplied by respective
valences, like: -546 +468 -56.2 +106.6 + .... one ends up with almost 0,
suggesting that the above values are about right. During the Challenger
Expedition of the 1870s, it was discovered that the ratios between elements
is nearly constant although salinity (the amount of H2O) may vary. Note
that the figures above differ slightly in differing publications. Also
landlocked seas like the Black Sea and the Baltic Sea, have differing concentrations.
This
world map shows how the salinity of the oceans changes slightly from around
32ppt (3.2%) to 40ppt (4.0%). Low salinity is found in cold seas, particularly
during the summer season when ice melts. High salinity is found in the
ocean 'deserts' in a band coinciding with the continental deserts. Due
to cool dry air descending and warming up, these desert zones have very
little rainfall, and high evaporation. The Red Sea located in the desert
region but almost completely closed, shows the highest salinity of all
(40ppt) but the Mediterranean Sea follows as a close second (38ppt). Lowest
salinity is found in the upper reaches of the Baltic Sea (0.5%). The Dead
Sea is 24% saline, containing mainly magnesium chloride MgCl2. Shallow
coastal areas are 2.6-3.0% saline and estuaries 0-3%.
Making sea salt Sea salt is made by evaporating sea water, but this is
not straight-forward. Between 100% and 50% first the calcium carbonate
(CaCO3= limestone) precipitates out, which is chalk and not desirable.
Between 50% and 20%, gypsum precipitates out (CaSO4.2H2O), which also tastes
like chalk. Between 20% and 1% sea salt precipitates (NaCl) but going further,
the bitter potassium and magnesium chlorides and sulfates precipitate,
which is to be avoided, unless for health reasons. In commercial salt production,
the water is led through various evaporation ponds, to achieve the desired
result.
Note that this process has also happened where large
lakes dried out, laying down the above salts in the above sequence. Note
that normal sea water is undersaturated with respect to all its salts,
except for calcium carbonate which may occur in saturated or near-saturated
state in surface waters.
An artificial salt solution of 3.5% (35ppt) is made by
weighing 35g of salt in a beaker and topping it up with fresh water to
1000g.
Density The density of fresh water is 1.00 (gram/ml or kg/litre) but added
salts can increase this. The saltier the water, the higher its density.
When water warms, it expands and becomes less dense. The colder the water,
the denser it becomes. So it is possible that warm salty water remains
on top of cold, less salty water. The density of 35ppt saline seawater
at 15ºC is about 1.0255, or s (sigma)= 25.5. Another word for density
is specific gravity.
The
relationship between temperature, salinity and density is shown by the
blue isopycnal (of same density) curves in this diagram. In red,
green and blue the waters of the major oceans of the planet is shown for
depths below -200 metre. The Pacific has most of the lightest water with
densities below 26.0, whereas the Atlantic has most of the densest water
between 27.5 and 28.0. Antarctic bottom water is indeed densest for Pacific
and Indian oceans but not for the Atlantic which has a lot of similarly
dense water.
Dissolved gases in seawater The gases dissolved in sea water are in constant equilibrium with the
atmosphere but their relative concentrations depend on each gas' solubility,
which depends also on salinity and temperature. As salinity increases,
the amount of gas dissolved decreases because more water molecules are
immobilised by the salt ion. As water temperature increases, the increased
mobility of gas molecules makes them escape from the water, thereby reducing
the amount of gas dissolved.
Inert gases like nitrogen and argon do not take part in the processes
of life and are thus not affected by plant and animal life. But non-conservative
gases like oxygen and carbondioxide are influenced by sea life. Plants
reduce the concentration of carbondioxide in the presence of sunlight,
whereas animals do the opposite in either light or darkness.
gas
molecule
% in
atmosphere
% in surface
seawater
ml/litre
sea water
mg/kg (ppm)
in sea water
molecular
weight
mmol/
kg
Nitrogen N2
78%
47.5%
10
12.5
28.014
0.446
Oxygen O2
21%
36.0%
5
7
31.998
0.219
Carbondioxide CO2
0.03%
15.1%
40
90 *
42.009
2.142
Argon
1%
1.4%
.
0.4
39.948
0.01
One kg of fresh water contains 55.6 mol H2O
* also reported as 80 mg/kg
Please note that these figures
may be incorrect as too many different values have been published
In the above table, the conservative gases nitrogen and argon do not
contribute to life processes, even though nitrogen gas can be converted
by some bacteria into fertilising nitrogen compounds (NO3, NH4). Surprisingly
the world under water is very much different from that above in the availability
of the most important gases for life: oxygen and carbondioxide. Whereas
in air about one in five molecules is oxygen, in sea water this is only
about 4 in every thousand million water molecules. Whereas air contains
about one carbondioxide molecule in 3000 air molecules, in sea water this
ratio becomes 4 in every 100 million water molecules, which makes carbondioxide
much more common (available) in sea water than oxygen. Note that even though
their concentrations in solution differ due to differences in solubility
(ability to dissolve), their partial pressures remain as in air, according
to Henry's law, except where life changes this. Plants increase oxygen
content while decreasing carbondioxide and animals do the reverse. Bacteria
are even capable of using up all oxygen.
All gases are less soluble as temperature increases, particularly nitrogen,
oxygen and carbondioxide which become about 40-50% less soluble with an
increase of 25ºC. When water is warmed, it becomes more saturated,
eventually resulting in bubbles leaving the liquid. Fish like sunbathing
or resting near the warm surface or in warm water outfalls because oxygen
levels there are higher. The elevated temperature also enhances their metabolism,
resulting in faster growth, and perhaps a sense of wellbeing.
Likewise if the whole ocean were to warm up, the equilibrium with the
atmosphere would change towards more carbondioxide (and oxygen) being released
to the atmosphere, thereby exacerbating global warming.
Since the volume of all oceans is 1.35E21 kg (see table
of units & measures) and CO2 concentration is 9E-5 kg/kg (90ppm),
it follows that the total amount of CO2 in all oceans is 12.2E16 kg = 121,000
Pg (Mt) and the partial carbon amount (12/42) = 34,700 Pg (600Pg
in surface waters + 7000Pg in mid waters + 30,000Pg in deep ocean = 37,600Pg
[1]). Compare this with the amount of carbon in soil and vegetation
(1301 + 664 = 1965 Pg, see soil/ecology)
and the carbon in the atmosphere, about 1 kg per square metre over 510E6
km2 = 510E12 kg = 510 Pg (700Pg [1]). It follows
that the ocean is a very large reservoir of carbondioxide, also called
Dissolved Inorganic Carbon (DIC). In addition to this, it contains Dissolved
Organic Carbon (DOC) of unknown quantity. The difference between DIC and
DOC is an arbitrary particle size of 0.45µm which passes DIC through
filtration paper. This definition does not distinguish our newly discovered
slush
(incompletely decomposed biomolecules) as DOC. See our DDA
section.
What is dissolved, particulate, inorganic and organic
carbon? Carbon is a miraculous element located in the middle
of the Periodic Table, next to nitrogen,
which is also a surprising element. Elements to the left are basic with
positive valence (attracting free electrons) and those to the right are
acidic with negative valence (owning loose electrons). Carbon with a valence
of 4 can bind with both sides of the table and with itself. When combined
with hydrogen, it forms long chains of organic molecules like CH3.CH2.CH2......X
where the end group X gives it the character of an alkane (CH3), alcohol
(OH), acid (COOH), aldehyde (COH), amino (NH2), and so on. The organic
carbon chains can form loops and bonds with other elements, all being organic
compounds. Only few inorganic carbon compounds are known, of which carbondioxide
(CO2) is by far the most common. Natural gas or methane (CH4) is either
the last inorganic molecule or the first organic molecule. So it is safe
to say that dissolved inorganic carbon is CO2, particularly
since it dissolves so readily in water.
All biomolecules that make up the structure of an organism
are organic (except for salts in body liquids), and when these are decomposed,
the leftover molecules are also organic, except for inorganic nutrients
and CO2, for the whole purpose of decomposition is to turn organic molecules
into inorganic nutrients and CO2 for plants. All biomolecules can be transported
by being dissolved in water. When an organism dies and decomposes, most
of its organic molecules end up in solution as dissolved organic carbon
(DOC), molecules that are very much smaller than the smallest of organisms
(viruses).
Plankton organisms are classified by size from femtoplankton
(smaller than 0.2µm), picoplankton (0.2-2µm) to megaplankton
(0.2-2m). Note that the wavelength of visible light is 0.4-0.7µm,
which means that organisms smaller than 1µm are not visible under
a light microscope (all viruses and most bacteria). What all this means
is that measuring the biomass of plankton is almost impossible. For practical
reasons, scientists decided that anything passing through fine filtration
paper (0.45µm) is dissolved and all that is retained is particulate.
Unfortunately this marks a substantial amount of particulate biomass as
dissolved.
Phytoplankton consists of organisms from bacteria to diatoms
and large dinoflagellates (like sea spark, Noctiluca scintillans).
Their biomass can be estimated by measuring their chlorophyl (green pigment)
from light measurements. However, other pigments (brown, red) are also
common and the amount of chlorophyl is only a small part of biomass. So,
even quantifying the amount of phytoplankton is almost impossible.
The bottom line is that the boundaries between dissolved,
particulate, inorganic and organic are rather vague. Also the functional
difference between producers (phytoplankton) and decomposers (most bacteria)
is seldom acknowledged.
Deep
sea temperature, oxygen & nutrients In general the ratios between the various elements in seawater is constant,
except where modified by life. In this diagram one can see how light penetrates
no deeper than 150m for photosynthesis. Indeed at 800m, the ocean is pitch
dark. In the surface mixed layer above the thermocline, water mixes sufficiently
to sustain life. Gas exchange with the atmosphere is near-perfect such
that the oxygen concentration in the water is in equilibrium with the atmosphere.
But it rapidly decreases below 50-75m as photosynthesis declines while
animals use up most oxygen. At around 800m oxygen levels reach a minimum
(as also carbondioxide levels reach a maximum, not shown). Towards the
deep and bottom water, oxygen levels increase slightly due to an influx
of cold bottom water from the poles. Due to lack of oxygen, deep sea fish
cannot be very active.
The coloured curves for phosphate and nitrate show how these nutrients
are almost completely used near the surface and how they gradually become
available in the thermocline layer. Note how the Atlantic Ocean ends up
with less nutrients than the Pacific and Indian oceans.
The temperature curve shows the general idea of staying relatively
high and constant in the mixed layer, then declining rapidly in the thermocline
layer until reaching a near constant temperature of +3ºC in deep and
bottom water. The maximum surface temperature of course depends on many
factors, like latitude and season.
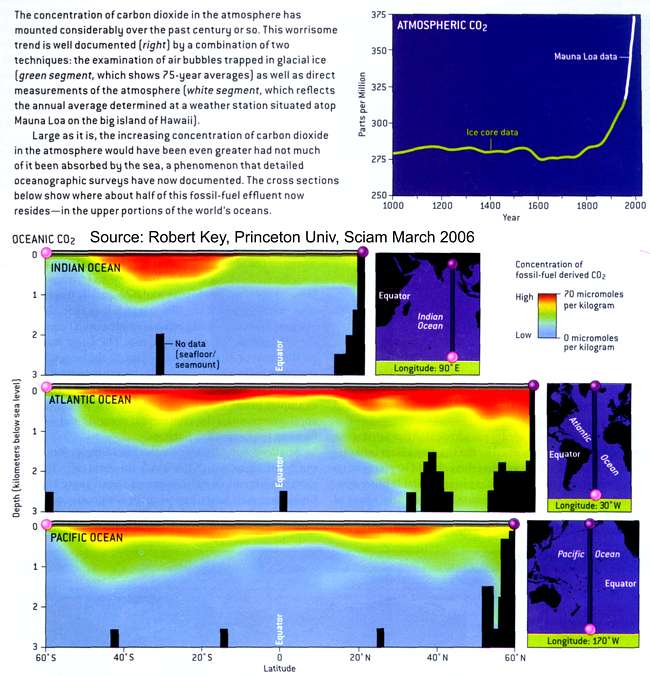
Note that the concentration of CO2 in the atmosphere has increased from
280 ppm in 1850 to 360 ppm in 1998, and is still rising. It is estimated
that about 50% of anthropogenic CO2 has been absorbed by the oceans. Because
the upper atmosphere is bombarded by cosmic rays, some of the nitrogen
atoms become radioactive isotopes C-14 with a half life of 5730 years.
Once incorporated into organisms, its radioactivity decays slowly, allowing
scientists to calculate the age of organic substances. Fossil fuels which
have been underground for over 60 million years, have lost nearly all their
radioactive carbon isotopes, and in this manner CO2 from burning fossil
fuels can be distinguished from normal CO2 circulation. The diagrams below
shows how fossil carbondioxide is absorbed by the oceans.
Radioactive Carbon-14 As cosmic rays bombard the outer atmosphere, they are
slowed down by the thin gases there. With their energy of billions of electron-Volt
(eV) they produce fast neutrons that gradually slow down to that of thermal
neutrons. At a height of about 9-15km, these neutrons collide with nitrogen-14
(normal nitrogen), producing radioactive carbon-14 (carbon with one extra
neutron). The total amount of C-14 produced each year is about 9.8kg for
the whole Earth, or about 1 atom C-14 for 1 trillion (1E-12) normal C-12
atoms. Nuclear tests have almost doubled the quantity in the atmosphere
in a peak (year 1964) that is gradually becoming normal again as the peak
is absorbed by organisms and the ocean. Radioactive carbon decays back
to nitrogen by emitting an electron (beta radiation) at the initial rate
of 14 disintegrations per minute per gram carbon. The C-13 carbon isotope
which is not radioactive, occurs for about one in every 100 atoms C. The
age of organic remains can thus be measured by counting beta radiation
from disintegrating atoms, but a much more sensitive method is by counting
all C14 atoms by mass spectrometry.
Because of its slow decay rate of 50% in 5700 years,
the total amount of C-14 in the atmosphere, biosphere and oceans is much
higher than 10kg. According to Libby (1955) who invented carbon dating,
the distribution of carbon and carbon-14 is as follows:
carbon reservoir
percentage
CO2 dissolved in oceans
87.5
Dissolved Organic Carbon (DOC) in oceans
7.1
Biosphere, all living organisms
4.0
Atmospheric CO2
1.4
Note that at a pH of 7.0 (neutral water) only 0.1 µmol/kg (10-7
) of water is dissociated into positive hydrogen ions H+ and
negative hydroxyl ions OH- . In the ocean where a pH of around
8 is found, this becomes even less at 0.01 µmol/kg, which makes
hydrogen ions twenty times scarcer than oxygen and 200 times scarcer than
carbondioxide. It explains how important the pH is to the productivity
of aquatic ecosystems. Visit our latest plankton discoveries in the Dark
Decay Assay section where this limiting factor was quantified in freshwater
lakes.
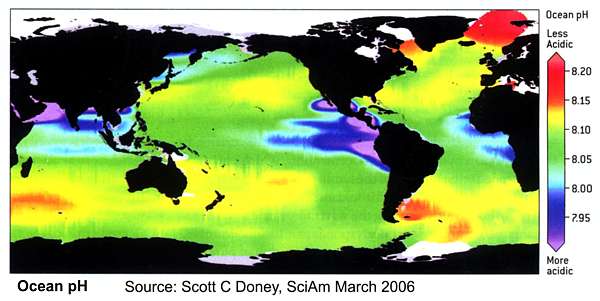
This world map of ocean acidity shows that ocean pH varies from about 7.90
to 8.20 but along the coast one may find much larger variations from 7.3
inside deep estuaries to 8.6 in productive coastal plankton blooms and
9.5 in tide pools. The map shows that pH is lowest in the most productive
regions where upwellings occur. It is thought that the average acidity
of the oceans decreased from 8.25 to 8.14 since the advent of fossil fuel
(Jacobson M Z, 2005).
Carbondioxide as bicarbonate Carbondioxide binds loosely with water to form bicarbonate:
in the ratios CO2 & carbonic acid H2CO3 = 1%, bicarbonate HCO3-
= 93%, carbonate CO32- =6%. These variants of CO2 (species)
add up to the total amount of Dissolved Inorganic Carbon (DIC), which also
includes a smaller amount of Dissolved Organic Carbon (DOC) that passes
filtration techniques.
The <=> symbol means 'in equilibrium with'.
These forms of carbon are always in close equilibrium with the atmosphere
and with one another. When one talks about dissolved carbondioxide, it
is the slightly acidic bicarbonate. When the concentration of CO2 in the
atmosphere increases, presumably also the concentration in the ocean's
surface increases, and this works itself through to the right in above
equation.
Photosynthesis of organic matter is often simplified as: CO2 + H2O +
sunlight => CH2O +O2, which happens only in the sunlit depths to
150m and down to where the sea mixes.
The average composition of marine plants is: H:O:C:N:P:S = 212:106:106:16:2:1
which comes close to CH2O.
Respiration is often simplified as : CH2O => CO2 + H2O + energy,
which can happen at all depths, depending on the amount of food sinking
down from above.
Therefore the concentrations of oxygen and carbondioxide vary with depth.
The surface layers are rich in oxygen which reduces quickly with depth,
to reach a minimum between 200-800m depth. The deep ocean is richer in
oxygen because of cool and dense surface water descending from the poles
into the deep ocean.
It is thought that the carbondioxide in the sea exists in equilibrium
with that of exposed rock containing limestone CaCO3. In other words, that
the element calcium exists in equilibrium with CO3. But the concentration
of Ca (411ppm) is 10.4 mmol/l and that of all CO2 species (90ppm) 2.05
mmol/l, of which CO3 is about 6%, thus 0.12 mmol/l. Thus the sea has a
vast oversupply of calcium.
[1] Report of the Royal Society (June 2005): Ocean acidification
due to increasing atmospheric carbon dioxide.
http://www.royalsoc.ac.uk/displaypagedoc.asp?id=13539 (1MB)
 This
world map shows how the salinity of the oceans changes slightly from around
32ppt (3.2%) to 40ppt (4.0%). Low salinity is found in cold seas, particularly
during the summer season when ice melts. High salinity is found in the
ocean 'deserts' in a band coinciding with the continental deserts. Due
to cool dry air descending and warming up, these desert zones have very
little rainfall, and high evaporation. The Red Sea located in the desert
region but almost completely closed, shows the highest salinity of all
(40ppt) but the Mediterranean Sea follows as a close second (38ppt). Lowest
salinity is found in the upper reaches of the Baltic Sea (0.5%). The Dead
Sea is 24% saline, containing mainly magnesium chloride MgCl2. Shallow
coastal areas are 2.6-3.0% saline and estuaries 0-3%.
This
world map shows how the salinity of the oceans changes slightly from around
32ppt (3.2%) to 40ppt (4.0%). Low salinity is found in cold seas, particularly
during the summer season when ice melts. High salinity is found in the
ocean 'deserts' in a band coinciding with the continental deserts. Due
to cool dry air descending and warming up, these desert zones have very
little rainfall, and high evaporation. The Red Sea located in the desert
region but almost completely closed, shows the highest salinity of all
(40ppt) but the Mediterranean Sea follows as a close second (38ppt). Lowest
salinity is found in the upper reaches of the Baltic Sea (0.5%). The Dead
Sea is 24% saline, containing mainly magnesium chloride MgCl2. Shallow
coastal areas are 2.6-3.0% saline and estuaries 0-3%. The
relationship between temperature, salinity and density is shown by the
blue isopycnal (of same density) curves in this diagram. In red,
green and blue the waters of the major oceans of the planet is shown for
depths below -200 metre. The Pacific has most of the lightest water with
densities below 26.0, whereas the Atlantic has most of the densest water
between 27.5 and 28.0. Antarctic bottom water is indeed densest for Pacific
and Indian oceans but not for the Atlantic which has a lot of similarly
dense water.
The
relationship between temperature, salinity and density is shown by the
blue isopycnal (of same density) curves in this diagram. In red,
green and blue the waters of the major oceans of the planet is shown for
depths below -200 metre. The Pacific has most of the lightest water with
densities below 26.0, whereas the Atlantic has most of the densest water
between 27.5 and 28.0. Antarctic bottom water is indeed densest for Pacific
and Indian oceans but not for the Atlantic which has a lot of similarly
dense water.