Poor Knights marine reserve going, going, gone: the degrading marine environment by Dr J Floor Anthoni (2007)
www.seafriends.org.nz/issues/res/pk/degrade.htm
The dire and worsening environmental situation
at the Poor Knights is being hushed up because it is not good for business
and it shows that marine reserves are no longer protecting the marine environment,
which is not good for the Department of Conservation and all those who
champion for more marine reserves. But here is the inside and true story,
for all to see and read. As long as we don't acknowledge the problem, a
solution will not be forthcoming. It is important reading for all who care
about the sea. For the future of our children it is important to be strictly
honest. This chapter shows the symptoms of decay. It also debunks the snapper-urchin-kelp
myth and brings some shocking observations and measurements. The marine
life at the Poor Knights is diminishing in quantity and quality.
.
symptoms of decay: clear symptoms
of environmental degradation at the Poor Knights
Symptoms of decay The marine environment at the Poor Knights is in serious decline, and
there is no doubt about this. The symptoms are there, as well as the measured
facts. The question remains why, and how this could happen to a remote
island so far away from the main land. In this chapter we will examine
these issues and direct you further to other chapters. Dr Anthoni has been
studying marine degradation since 1987, as it was the very reason for him
to change his vocation from computers to marine ecology. In the meantime
he has made important discoveries that challenge our understanding of how
the sea (and the planet) works. Please note that the Seafriends web site
is the ONLY place where you can read about this.
First we will show some images, all taken at the Poor Knights, of what
degradation looks like. Remember that degradation is about disease and
death without successive recovery, or incomplete recovery. It is about
living organisms disappearing, which is not easily seen, for how can one
see what is no longer there? Therefore the sick organisms are more important
than their numbers suggest. A sick sea urchin will vanish in a week's time,
usually without trace. If only one in a hundred urchins shows sickness,
it could already signal a seriously declining situation, for in 50 weeks
half the population could disappear.
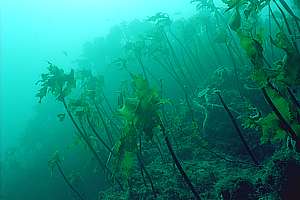
Let's
look at the stalked kelp first (Ecklonia radiata), for it occupies
such a dominant habitat space in New Zealand. Its upper boundary is determined
by the worst waves which simply remove it occasionally. In its place thrives
a very productive community of short and almost invisible algae, grazed
by sea urchins and molluscs, and also by fish. These barren zones occur
wherever the sand bottom is deeper than 15m. At the Poor Knights some of
the barren zone is occupied by the very strong strapweed (Lessonia variegata).
The deep boundary of the kelp forest is determined by lack of light, due
mainly to the limited underwater visibility of the water. At the Poor Knights
this boundary used to be 36m deep on shores facing north towards the sun.
In recent years it has been shifting upward to 27m, which amounts to a
substantial change in the marine environment, all due to declining water
clarity.
The diagram shows how the marine habitat zones shift while both quantity
and quality of life diminish. On left the situation in clear water, with
healthy organisms, deep zones and high biodiversity. On right a highly
degraded shore with low densities and low biodiversity.
Seaweeds are always good indicators of marine degradation because they
stay in one place, are not fished and they are usually quite hardy. So
they are not showing the very first signs of degradation, for which sponges
are more suitable. But seaweeds produce slime, and when they don't, they
are sick, which can easily be tested by any amateur.
So one sees mature plants in trouble, but isn't it natural that the
old eventually die? True. Therefore the young ar much more important. As
the old die, they make room for the young who compete for their place.
So there are always many more young ones than old ones, and it so happens
that the young ones are more sensitive to disease and bacterial attack
than the old ones. When looking for degradation, always ask "where are
the young ones?".
When one sees an open kelp forest, it must be covered in young plants.
When seeing a Sandager's wrasse, immediately look for the young ones of
which there should be at least ten times as many. Where are they? Where
are the young wrasses, angelfish, butterfish, urchins, seastars, crayfish,
. . . .?
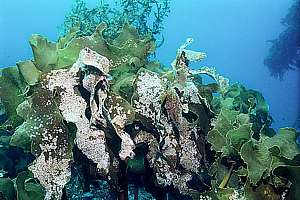
f045327: it is only 15m deep at the bottom of Nursery Cove,
and the kelp is in such poor condition that it cannot fend off (slime off)
encrusting sea mats (bryozoans). These leaves do not feel slimy any more.
f046123: at the same location, a few months later, most kelp
plants have disappeared, and those remaining now are dead but still standing,
covered in encrustations and algae.
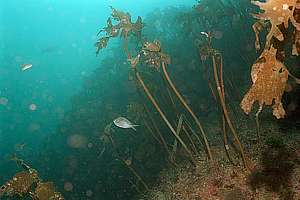
f042708: on the north-facing wall of Rikoriko, the kelp boundary
is retreating to above 30m. This photo was taken with flash light to show
the poor condition of the kelp (dark brown and tattered). These plants
are not dying - they are dead already.
f042706: the same place as on left, but without flash. One
can now see in the distance, a poor 15m. Clearly the kelp forest is dying
because there are no young plants to take over. The lower kelp boundary
has shifted from 36m to 27m!! A whopping habitat change. Next year, these
symptoms will have disappeared, as the boundary has shifted.
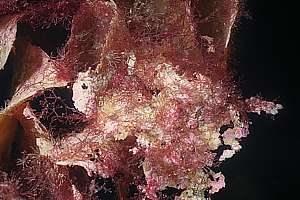
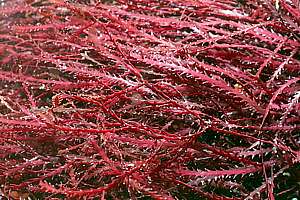
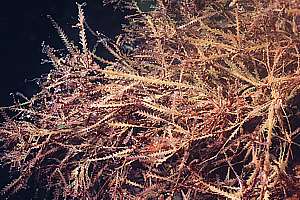
f051211: the red fretsaw weed (Vidalia colensoi) is
not slimy but is very tough, able to grow in the barren zone. It also resists
grazing by urchins, and has little food value.
f046134: this red fretsaw weed is not sick but dead, even
though its woody skeleton may persist for a long time. Remember that the
sea does not have strong wood-decomposing fungi, such as found in soil.
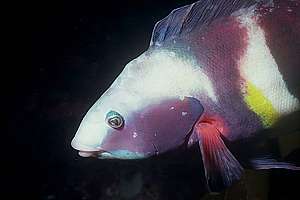
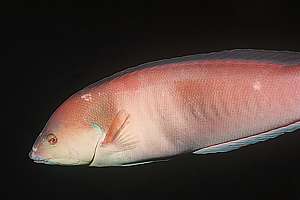
f046121: a male Sandager's wrasse with a serious case of
white rot (probably a fungus). In an aquarium, this fish has only one more
week to live.
f046132: a female Sandager's wrasse with the beginnings of
white rot, but she may still survive.
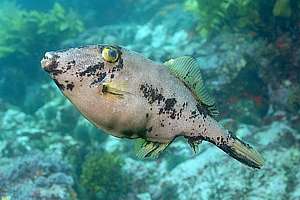
f049026: leatherjackets are often seen with a black skin
disease, particularly at outer islands like the Poor Knights. It is not
certain whether this is a recent symptom. But a fact is that their numbers
have declined steeply.
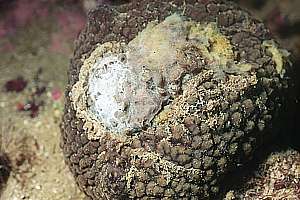
f046133: a grey nipple sponge (Polymastia sp.) with
a serious case of rot, which they usually can't conquer. A sponge like
this will vanish within ten days. Note how it has contracted to a hard
mass, a sure sign of sickness.
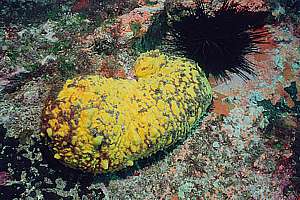
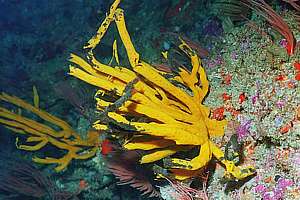
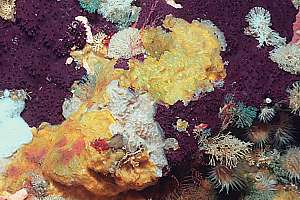
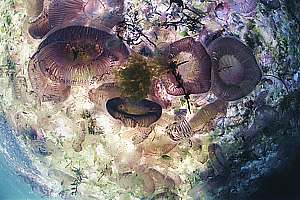
f042719: a yellow nipple sponge (Polymastia croceus)
in a serious state of decay. When such sponges are not happy, they contract
into a hard mass. Happy nipple sponges are fluffy.
f048510: a rough antler sponge (Iophon proximum) showing
black rot, is one of many in Butterfish Bay.
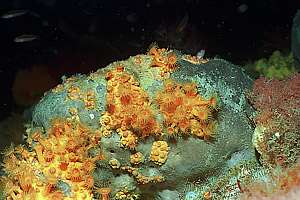
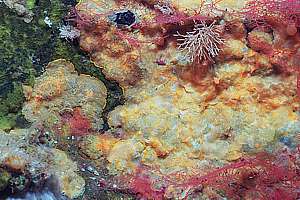
f035407: yellow zoanthid anemones invading a grey sponge
who has lost its ability to defend against this. Zoanthid anemones used
to be rare, but are now very common, a sign of degradation. Degradation
can look beautiful.
f045325: the grey ancorina sponge (Ancorina alata)
is one of the hardiest sponges in NZ, yet it can become overpowered by
marine phytoplankton, suffocating it, as shown here.
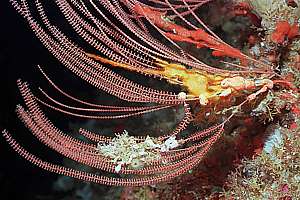
f043409: a beadlet coral (Primnoides sp.) being invaded
by encrusting sponges and other invading organisms. This can be an entirely
normal event, but seeing many affected like this, raises alarm.
f043418: normally when a large sponge dies, it leaves an
empty spot in the tapestry of life, and these spots can be recognised.
However, in a very short time, opportunistic fast growing species like
these yellow bryozoan mats, cover such empty spots.
f043419: yellow bryozoan mats overgrowing vacant territory,
caused by a shift in habitat boundaries. (Middle Arch).
f043435: we see more invasive species like these fast growing
grey seasquirt mats. Of course there will always be winners and losers
in the competition for space.
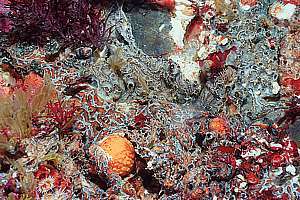
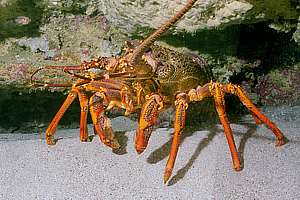
f051135: although not being threatened for over twenty years,
crayfish have not returned. Where are the young crayfish that one should
see on every dive?
Note that the above examples document but a tiny fraction of what any
diver can find in a few dives.
The snapper-urchin-kelp
myth Much
ado has been made about sea urchins inside marine reserves, and the myth
goes like this: sea urchins eat kelp, reason why there are barren zones
in the sea. But in marine reserves the snapper grow so large that they
can eat sea urchins. With fewer sea urchins, the kelp returns. Urchins
bad, kelp good. Unfortunately this is one of the worst misadventures of
marine science, and has been debunked extensively by us, based on their
own work and our investigations. But a myth persists for a long time, still
enthusiastically spread by marine reserves advocates of which the Department
of Conservation is most guilty. Now children at school are learning this.
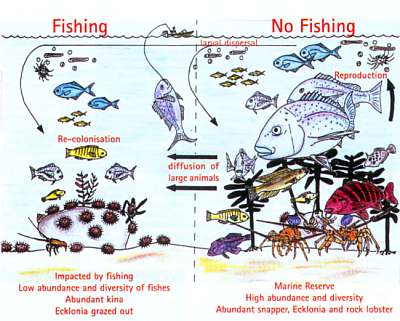
The drawing shows what this myth has led to: without complete marine
protection, snappers are caught, which allows sea urchins to multiply unchecked.
These prickly grazers attack kelp and in doing so, clear the kelp forest.
The underwater productivity decreases, and many kelp-eating fish disappear.
Inside marine reserves, however, the big snapper clean out the urchins,
the kelp returns, and with it kelp eating fish. Crayfish also become bigger.
These big fish produce more spawn, which is exported by ocean currents.
The problem with this attractive narrative is that it is entirely false.
It is true that the urchin barrens in the Goat Island marine reserve (and
Tawharanui marine reserve) have been overrun by kelp, but this happened
also outside marine reserves. In fact, now in 2007, it has happened in
most of the entire east coast of the North Island. What scientists fail
to mention is that in 1993 the whole kelp forest disappeared, between 1995-1998
the sea urchins, and in 1998 the crayfish. It shows overwhelmingly that
a marine reserve is not capable of protecting marine biodiversity, let
alone save the sea. Reader, notice in this respect that we at Seafriends
fight to save the sea, not to put marine reserves in that won't work!
There is obviously something happening that we don't understand, and
this has been Dr Anthoni's focus for the past twenty years. It has resulted
in epoch-making discoveries of the most basic ecological laws of our planet.
Follow the links above to learn more.
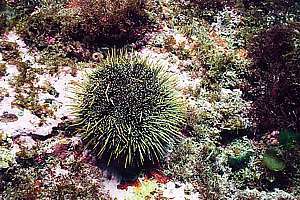
f042803: an urchin folding its spines is almost a sure sign
of ill health. In fact, the animal inside can already be dead and stinking,
while the spines and tubefeet outside appear normal!
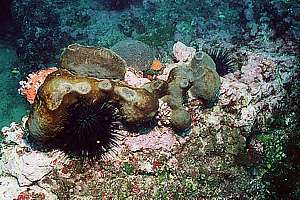
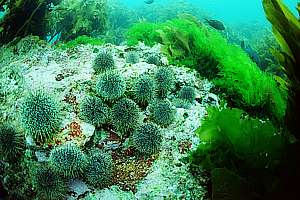
f045234: sea urchins have grouped together as they are grazing
their patch, fully exposed to potential predators. In the distance, the
green sea lettuce is taking over. We should ask ourselves, where the kelp-eating
fish are that keep sea lettuce trimmed to a fine mat.
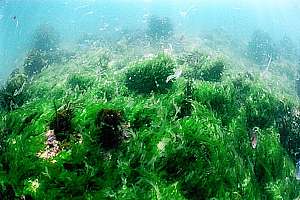
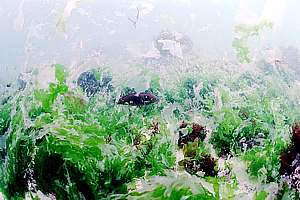
f045221: seaweed is food and if it is not eaten, it will
go to rot. Here the green sea lettuce is rotting away because grazing fish
and urchins are no longer there to trim it back.
f045224: shards of rotting sea lettuce leaves, looking like
soaked toilet paper. Where rot sets in, like the one rotten apple in the
fruit bowl, others become infected. More seaweed means more rot and more
deaths.
Other symptoms of decay Environmental deterioration has not been left unobserved in freshwater
lakes and in the sea, where it is generally known as eutrophication
(over-nourishment). It is all about nutrients (natural and unnatural
fertiliser). Life cannot exist without nutrients, so a little of it is
absolutely necessary. So it follows that more is better. But this has a
limit, after which sickness and death set in. Amazingly, scientists do
not know why, as they guess at the symptoms. Admittedly, the sea is rather
complicated and seldom performs 'as expected'. The sea is stranger than
one can possibly imagine!
Here is how international scientists describe the symptoms of worsening
eutrophication, in order of severity:
Eutrophication symptoms
reported by mainstream science
disturbance of a 'balance' within
the plankton, reflected in the Redfeld Ratio of N:P:Si=16:1:1.(Nitrogen,
Phosphorus, Silicon)
non-siliceous plankton species
(dinoflagellates etc.) dominate vs siliceous ones (diatoms, flagellates).
increased plankton primary production
(phytoplankton) compared to benthic (bottom) primary production.
increase in phytoplankton but
a decrease in zooplankton.
growth of micro algae and nuisance
species and opportunistic species, particularly in fresh water.
harmful algal blooms (HABs)
of non-siliceous species (dinoflagellates etc.).
microbial foodwebs (bacteria)
dominate compared to linear food chain (zooplankton to fish).
reduction in species and biomass.
gelatinous zooplankton (jellies)
dominates vs crustacean zooplankton (krill etc.).
oxygen depletion and H2S (hydrogensulphide)
formation.
death.
Notice that one symptom is the appearance of gelatinous zooplankton
(jellyfish). The Poor Knights have always been awash in jellies of all
kind, particularly while conditions were still excellent, in the 1960s.
And now we do not see those salps and jellies as much as they used to.
What is going on?
As a photographer I am keen to document the many types of jellyfish
frequenting our seas, but in the past decade they have largely disappeared.
Our own measurements with the Dark Decay Assay show that the Poor Knights
are in two kinds of water, one with reasonable health and the other with
high bacterial attack and ill health, and that the quality of the water
improves with depth. In other words, degradation is particularly strong
in the shallows. It seems as if the food chain is not working, food heaping
up in the form of invisible tiny gelatinous plankton that concentrates
near the surface, where it rots away with high concentrations of bacteria.
But degradation is more sneaky than that.
f045231: a graveyard of purple jellyfish normally found in
cooler waters.
f012425: the X-wing gooseberry looks like a normal sea gooseberry
when it furls its wings, see below.
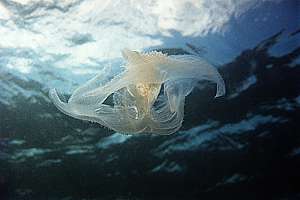
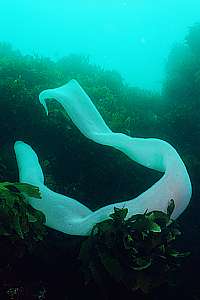
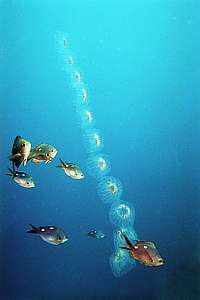
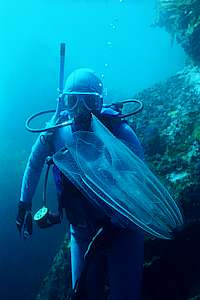
f038718: a large salp (Pyrostremma spinosum) stranded
in the kelp forest. It is shaped like a rigid long sock consisting of 1cm
long animals pumping water from the outside in, while sieving it for food.
f028008: rosettes of pelagic seasquirts, all joined together.
As the seasquirts pump water through their bodies, the chain is propelled.
Previously common, now rare.
f038635: an X-wing sea gooseberry with its wings furled (rolled
up). These comb-jellies are very complex with their wings and spiralling
whips.
We discovered that the planktonic bacteria are of decisive influence
on the health of all marine organisms, some species more than others. Increase
the amount of food by raising the nutrients, and instead of it benefiting
the food chain from zoo plankton to fish, it benefits the decomposing bacteria
who then kill the zoo plankton and food chain. The big change happens at
about 15m visibility, and this is precisely the barrier that the Poor Knights
have been breaking in recent years. For instance, in all of our measurements
in 2006, visibility was never better than 18m, and often less than 6m.
Another overwhelming but not quite obvious indicator of the loss of
fish and them not reaching old age, are the demoiselles. Their numbers
are way down compared to the sixties and seventies, but so is their age.
Old demoiselles of over 5 years, are deep blue with bright white tails,
whereas the younger ones tend to be greenish-blue or bluish with pale spots.
Another indicator is that few of them breed, and many of the rocks once
covered in breeding male demoiselles, now lie barren or are overgrown with
weeds. In the good days there were so many males that each did not have
more territory than a spread hand. Now their territories are 4-6 times
larger. The same counts for the black angelfish.
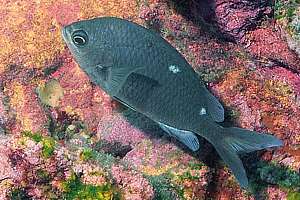
f019816: a mature 5-7 year old male demoiselle (Chromis
dispilus) is almost deep blue (chromis=blue) with a white tail,
but not quite like it used to be. These can no longer be found on the Poor
Knights.
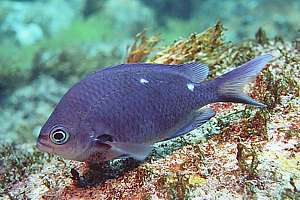
f032712: the male demoiselles now found at the Poor Knights,
although mature, are no older than 4 years, and their colour has not deepened
to blue, and neither have their tails become white.
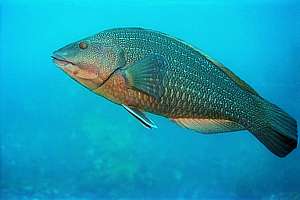
Indicators of loss of life are not necessarily expressed in numbers
and sizes. A very sneaky indicator is that the female green wrasses have
disappeared but not the males. This is because all females eventually become
male and if there is no offspring, one ends up with males only and the
end of reproduction. At the moment most wrasses are in some way affected,
although their females have not altogether disappeared.
f012604: a female green wrasse is green-brownish with longitudinal
stripes above and a large scale pattern underneath. She does not have white
fins. This one is already on her way to become male.
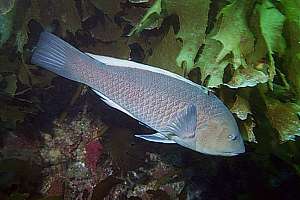
f020611: the male green wrasse (Notolabrus inscriptus)
honours its name with a scale pattern as if inscribed. It is blue-green
with white fins. It is a sturdy and big wrasse living in exposed shallows,
while patrolling a large territory.
Cycles and trends In 1983 veteran divers were shocked, witnessing the mass mortality
of demoiselles at the Poor Knights and further north. Also some of their
favourite black coral trees died. It was suggested that an unusually warm
summer had lowered the thermocline to kill the cold water black corals.
The cause of the demoiselle kill-off was more mysterious. As stated above,
the problem with fish dying, is that the dead fish are seldom seen, particularly
when the kill happens over a period of several months, enough for scavengers
(birds and fish) and decomposers to keep up. In addition, we do not dive
frequently enough to be there when it happens, and to make matters worse,
we are not observant enough to notice a difference after it happened.
But I've kept a timeline of events
that documents the mass mortalities and other observations. It appears
to happen in a nine year cycle: 1983, 1992, 2001 and we're expecting 2009-2010
to do the same.
When something happens in cycles, scientists automatically conclude
that it must be natural, but there is no proof for this. Nature has its
cycles, but such cycles can synchronise unnatural events such as harmful
plankton blooms. Harmful plankton blooms (HABs) are now reasonably well
understood, in the sense that mysteriously, some naturally rare species
become abundant, and when they are poisonous, can cause mass die-offs.
Dinoflagellates (horrible flagellates) are some of the most harmful ones.
But the guild of ordinary planktonic decomposing bacteria, has completely
been overlooked, and their numbers are steadily increasing as the land
erodes faster and faster, while more and more fertiliser is used, and the
human population with its livestock, is expanding.
It still remains a mystery why the Poor Knights, located at the edge
of the continental shelf, and well away from the degrading influences of
Auckland and Whangarei, is so threatened. It makes even less sense considering
the fact that Northland is so small with so few people and livestock, while
also the big rivers all flow to the west coast. Add to that the East Auckland
Current, an offshoot of the East Australian Current, and the mystery is
complete.
But our measurements show that the filthy water from the Waikato and
Auckland's sewage, plus the Kaipara, all flow northward, around North Cape
and back, lining the East Auckland Current on the land side, and flowing
undiminishedly to the Poor Knights. So, in the end, it is likely that Auckland
and the Waikato are threatening the Poor Knights! A marine reserve cannot
stop this. We have to be smarter.
Declining fish
stocks The full closure of the Poor Knights at the end of 1998 offered a perfect
opportunity to measure how a marine reserve reacts to full protection.
Previously only a small part of the reserve had been fully protected, allowing
fishing with unweighted lines in the remainder. Scientists from the Leigh
marine Laboratory of the University of Auckland were contracted to conduct
this research [1] which resulted in report DSIS142 to the Department of
Conservation. The main result is shown in the two graphs below.
Snapper counts inside the Poor Knights marine reserve
(solid circles), the Mokohinau Islands (solid triangles) and Cape Brett
(open squares). On left with the Baited Underwater (BUV) Video and on right
through Visual Underwater Census (VUC). The right-hand graph was obtained
by us from DOC and does not appear in the report DSIS142. The red average
curves were drawn by us.
This study gives a good insight in how poorly scientists conduct their
experiments. For instance, it was done as a before-and-after experiment
where changes are explained as having been caused by the in-between (full
protection). Immediately snapper numbers rose from 1 to 9 in the BUV, heralding
an outstanding success of marine protection. Then somebody cautioned that
they better include similar areas by way of control, and one year later,
at the third data point, Mokohinau Islands and Cape Brett were taken in
consideration. The study was continued for four full years, showing that
snapper had increased by similar numbers in all three places. But DOC was
foolish enough to claim that snapper had increased 16-fold, comparing the
highest point after, with the lowest point before closure. It would have
been more prudent to draw the red average curves, because the high point
before closure was missing.
But there is something fishy with all this, because snapper only were
counted with the BUV, whereas all other species were counted by visual
census. Furthermore we have deep misgivings about the BUV because it does
not satisfy the primary requirement of a measuring technique: not to influence
the quantity measured. To the contrary, the BUV feeds snapper with pilchards,
and then counts the maximum number of snapper in any one frame. It is a
method designed to maximise its outcome. So we requested the visual census
data, because from the report we knew that this had been done too. It is
shown on right. As you can see, its result is as inconclusive but showing
more fluctuation. Apparently snapper arrive in summer from somewhere outside
the reserve, while only few stay in winter. The same for Mokohinau and
Cape Brett. Thus most snapper are migratory and therefore not protected
by the reserve. However, divers notice that there are more big snapper
around, as can be expected. But what is the story with the other species?
After the BUV survey continued into 2009 [2], the following became evident:
The big snapper that arrived in 1998-2000, came from outside the Poor Knights.
The large snapper dominate, particularly in summer, but they vanish again
in winter.
Small snapper belong to the coast where they are hatched, and only after
reaching a certain size can they migrate offshore.
Snapper numbers appear to have stabilised.
It cannot be shown that the marine reserve was the cause of the increase
in big snapper, although those who stay, can grow bigger.
It is not known whether the big snapper remain inside the marine reserve
during winter. If they don't, they won't be protected.
Marine habitats did not change due to the presence of big snapper. Sea
urchins did not increase or decrease in numbers, neither did seaweeds.
[3]
From
the DSIS142 report we took the counts for those fish that belong to the
Poor Knights thus not the overstayers that come during some years and disappear
otherwise. Their results are summarised in the diagram on right. What does
it tell us? Fish have been counted by swimming along a transect line and
covering 125m2 each time, about the size of a tennis court. Look at the
red pigfish (orange curve) and you see that in 1998 about one pigfish could
be found in an area the size of a tennis court. Four years later it took
two tennis courts to find one. As you can see, the story is quite similar
for the other species, but quite disastrous for butterfish, banded wrasse
and leatherjacket who declined 10-15 fold. The decline cannot be explained
from a lack of food as for all, plenty of food is available.
One sad thing about all this work is that somebody decided not to census
the pelagic fish like blue maomao, trevally, demoiselle, koheru and jackmackerel.
We queried DOC about this, and the answer was that fish schools are too
variable and difficult to count (Oops!). Then again, they did count sweep,
which is a schooling fish. What is so sad about this decision is that the
scientists entirely missed the mass mortality event of 2000-2001. But what
did emerge is that sweep, a coastal fish that does not belong to the Poor
Knights, made a spectacular debut, from zero to 3, becoming more numerous
than any of the others shown in the graph. Indirectly this implies that
the water quality of the poor Knights has degraded to a level less suitable
for blue maomao but more suitable for sweep.
The big message for the public is that even our best marine reserve
does not protect marine life in the presence of degradation, and that the
situation with all our other coastal marine reserves is far worse. Yet
this government is pushing for more marine reserves, for the sole reason
that it signed a biodiversity consensus convention. Read the supporting
chapters to understand what is happening.
 Let's
look at the stalked kelp first (Ecklonia radiata), for it occupies
such a dominant habitat space in New Zealand. Its upper boundary is determined
by the worst waves which simply remove it occasionally. In its place thrives
a very productive community of short and almost invisible algae, grazed
by sea urchins and molluscs, and also by fish. These barren zones occur
wherever the sand bottom is deeper than 15m. At the Poor Knights some of
the barren zone is occupied by the very strong strapweed (Lessonia variegata).
The deep boundary of the kelp forest is determined by lack of light, due
mainly to the limited underwater visibility of the water. At the Poor Knights
this boundary used to be 36m deep on shores facing north towards the sun.
In recent years it has been shifting upward to 27m, which amounts to a
substantial change in the marine environment, all due to declining water
clarity.
Let's
look at the stalked kelp first (Ecklonia radiata), for it occupies
such a dominant habitat space in New Zealand. Its upper boundary is determined
by the worst waves which simply remove it occasionally. In its place thrives
a very productive community of short and almost invisible algae, grazed
by sea urchins and molluscs, and also by fish. These barren zones occur
wherever the sand bottom is deeper than 15m. At the Poor Knights some of
the barren zone is occupied by the very strong strapweed (Lessonia variegata).
The deep boundary of the kelp forest is determined by lack of light, due
mainly to the limited underwater visibility of the water. At the Poor Knights
this boundary used to be 36m deep on shores facing north towards the sun.
In recent years it has been shifting upward to 27m, which amounts to a
substantial change in the marine environment, all due to declining water
clarity.
 Much
ado has been made about sea urchins inside marine reserves, and the myth
goes like this: sea urchins eat kelp, reason why there are barren zones
in the sea. But in marine reserves the snapper grow so large that they
can eat sea urchins. With fewer sea urchins, the kelp returns. Urchins
bad, kelp good. Unfortunately this is one of the worst misadventures of
marine science, and has been debunked extensively by us, based on their
own work and our investigations. But a myth persists for a long time, still
enthusiastically spread by marine reserves advocates of which the Department
of Conservation is most guilty. Now children at school are learning this.
Much
ado has been made about sea urchins inside marine reserves, and the myth
goes like this: sea urchins eat kelp, reason why there are barren zones
in the sea. But in marine reserves the snapper grow so large that they
can eat sea urchins. With fewer sea urchins, the kelp returns. Urchins
bad, kelp good. Unfortunately this is one of the worst misadventures of
marine science, and has been debunked extensively by us, based on their
own work and our investigations. But a myth persists for a long time, still
enthusiastically spread by marine reserves advocates of which the Department
of Conservation is most guilty. Now children at school are learning this.
 From
the DSIS142 report we took the counts for those fish that belong to the
Poor Knights thus not the overstayers that come during some years and disappear
otherwise. Their results are summarised in the diagram on right. What does
it tell us? Fish have been counted by swimming along a transect line and
covering 125m2 each time, about the size of a tennis court. Look at the
red pigfish (orange curve) and you see that in 1998 about one pigfish could
be found in an area the size of a tennis court. Four years later it took
two tennis courts to find one. As you can see, the story is quite similar
for the other species, but quite disastrous for butterfish, banded wrasse
and leatherjacket who declined 10-15 fold. The decline cannot be explained
from a lack of food as for all, plenty of food is available.
From
the DSIS142 report we took the counts for those fish that belong to the
Poor Knights thus not the overstayers that come during some years and disappear
otherwise. Their results are summarised in the diagram on right. What does
it tell us? Fish have been counted by swimming along a transect line and
covering 125m2 each time, about the size of a tennis court. Look at the
red pigfish (orange curve) and you see that in 1998 about one pigfish could
be found in an area the size of a tennis court. Four years later it took
two tennis courts to find one. As you can see, the story is quite similar
for the other species, but quite disastrous for butterfish, banded wrasse
and leatherjacket who declined 10-15 fold. The decline cannot be explained
from a lack of food as for all, plenty of food is available.