By Dr J Floor Anthoni (2000)
www.seafriends.org.nz/oceano/currents.htm
The world consists almost for 80% of water
(oceans). Not surprisingly, these play a major role in the world's natural
affairs. For instance, all rain originates from the oceans. Ocean temperatures
are stable from day to day and change slowly with the seasons, but land
temperatures swing wildly from day to day and season to season. This chapter
explores circulation in the atmosphere, which leads to weather and climate,
and circulations in the oceans. The first part of this large page is about
air circulation, and the second part about ocean circulation. What causes air circulation? What kind of
solar energy reaches the planet and what reaches the surface? How is solar
radiation filtered? How is the Earth warmed? How are the world's climates
made? What happens during summer and winter? Why are deserts found where
they are?
.
please note that this document covers: part1
air circulation (this page) and part2
ocean circulation
Solar energy reaches the planet on its outer
atmosphere. Some is reflected and some reaches the surface through a number
of natural filters that protect life on earth. What reaches the surface,
warms it up and makes plants grow. Atmosphere, ionosphere, exosphere, Van
Allen radiation belts, magnetosphere, satellites, orbits.
The solar radiation warms the surface of the
planet and its atmosphere. Various gases filter incoming and outgoing radiation,
resulting in a planet which is liveable. Solar radiation, blackbody, terrestrial
radiation, atmospheric gas filters, absorption and shade, photosynthetic
absorption, seasons.
The way air circulates in the atmosphere is surprisingly
complicated. It governs the climate all over the world. During summer and
winter, predictable areas of high and low pressure develop and the winds
associated with them. General global circulation, Hadley Cell, jet stream,
deserts,
The water retained as moisture in
the air, brings life to the continents where it circulates almost independently
from that above the oceans. Humans have disrupted this water cycle by changing
forests into agriculture and urban development, which in turn changed the
climate.
Currents and winds are deflected by Coriolis
forces. How do they work? How do winds and currents react? What is an Ekman
Spiral? How do layers of air or water move?
The surface currents are driven by wind blowing
over the ocean's surface. Where winds blow predictably, these currents
are predictable also their associate climates. Map and names of currents.
Most of a water particle's life is spent in the
deep sea and nutrients befall the same fate. Yet at places on Earth, the
cool bottom water is able to resurface and sea life here is bountiful.
Wind-driven currents depend on the vagaries of
climate and climate depends on ocean currents. An introduction to the El
Niño climate variation that affects nearly the entire world's climates.
-- previous page -- next
page -- 20000825,20011124,20030130,20030328,20060806,20060826,20070718,
Introduction In this chapter we start with the atmosphere, since the sunlight arriving
at the planet's surface is influenced by it, and thus climate and winds.
The main current systems in the oceans arise from winds blowing over the
water's surface. See also
wind and waves. Where
such winds blow for prolonged periods and with sufficient force, the ocean's
water will be moved at speeds between 0.5 and 2 km/hr, contributing directly
to the heat transport towards the poles. Much of the climate depends on
these currents, which in turn, depend on the climate. Both the weather
and the ocean currents are therefore in constant oscillation or instability.
One of these is the El Nino climate/current cycle that influences rainfall
and drought far afield and which will be treated in detail in its own chapter.
Also ocean productivity depends largely on upwellings caused by ocean currents.
More of that in the chapter on plankton and how to feed the world. Ultimately,
the health and physics of the oceans, plays an important role in the way
our planet will warm in response to the burning of fossil fuels. That too,
will have its own chapter.
Atmosphere Because
the circulation of water and air depend on the amount of heat arriving
at the planet's surface, it is important to understand what happens to
the sunlight from the moment it enters our atmosphere. This simple picture
helps to relate the relative distances involved. If the planet were the
size of a billiard ball, say 5 cm across, then the whole surface of the
planet, from Mt. Everest to the deepest ocean trough (20 km) would be no
thicker than a human hair. Here is where everything happens to life (the
biosphere). Within this human hair, there are at least two layers in the
atmosphere and two in the ocean that move almost independently of one another.
At a distance of 150-300 km, the atmosphere is so thin that spacecraft
can orbit there in low orbit (LEO). The geostationary satellites orbit
some 36000 km higher, a distance of about six times the radius of Earth
(GEO).
vsit http://satellitedebris.net/Database/LaunchHistoryView.php
for nearly 8000 satellites in orbit by mid-2014
The atmosphere
is a blanket of protective gases providing insulation against otherwise
extreme alterations in temperature. Earth's gravity pulls the gases towards
its surface where the pressure is 1 bar, decreasing rapidly with height.
At 100 km height, the pressure is only one millionth. About 80% of the
atmosphere is found in the first 15 km; half in the first 5 km.
In
the diagram, the various zones are shown. Note that their boundaries vary
appreciably from pole to equator and from day to night. The outer zone
is the exozone which gradually fades into space. At 600 km the pressure
is a mere 1E-38 bar or less than a trillionth of a trillionth of a trillionth
of surface pressure. Only the fastest atoms of the lightest gases, Hydrogen
and Helium are found here.
Close to the surface, the troposphere (between
8 km at the poles and 15 km at the equator) is where the weather and climate
reign. It contains 85% of the atmospheric mass. Air temperature falls steadily
at about 4-8ºC for every km height, 8ºC at the tropics and almost
nil at the North Pole in winter. Where the passenger airliners fly, 10
km, the temperature is -60 degrees, varying with day and night and other
conditions. Near the surface of Earth, the temperature is on average 15
degrees and the air is composed of 78% nitrogen, 21% oxygen and 1% argon.
The tropopause is a region where the temperature
starts to rise again, forming the boundary with the stratosphere, which
extends upward to 50 km. Here is where protective ozone is found (20-50
km). The stratosphere absorbs ultraviolet light, which warms it. Just above
the ozone layer, the temperature drops again gradually to -80 degrees at
the mesopause.
In the ionosphere, air particles are electrically
charged by the sun's radiation, being able to move at high speeds in the
almost perfect vacuum. The temperatures shown in the diagram, therefore
have little meaning. A space craft in this zone would not experience it.
Four electrically charged layers are found here, the D, E, F1 and F2 layers.
These are capable of bouncing radio waves of various frequencies, enabling
radio transmitters to beam their programmes much further. Short-wave radio
frequencies are able to reach the other side of the planet under favourable
conditions. Medium wave (MW) transmissions benefit from the D layer, which
becomes active in the night.
Polar auroras occur between 65 and 965 km height
in the polar regions. Meteors from outer space burn up in the lower ionosphere,
at around 100-150 km height.
The
magnetosphere In the outer exosphere, above 500 km, only protons and electrons and
particles arriving by solar wind (400 km/s=1.4 million km/hr), are found.
Spiralling along the sun's magnetic field lines, they arrive here in four
days. They are trapped by the Earth's magnetic field lines, concentrating
in two belts at 3000 and 16000 km height, named after their discoverer,
James A Van Allen (1958). The inner belt contains mainly protons with energies
exceeding 30MeV (million electronvolt), whereas the outer belt contains
mainly fast moving electrons and slow moving helium ions, with energies
exceeding 100MeV. Radiation in both belts is so high (20,000 hits per second
per cm2) that it is effectively a no-go zone for spacecraft and astronauts.
In the top left, the path of a charged particle arriving from the sun,
is shown. As it encounters the magnetic field, it starts to corkscrew towards
one of the poles, eventually being repelled by the intensity of field lines
near the magnetic pole. At times it may interact with the atmosphere's
molecules at some 100 km height, producing the flickering light curtains
of the Aurora Borealis. Eventually these charged particles are swept into
one of the Van Allen Belts. The sun's 'wind' of solar particles compresses
the magnetosphere at the windward side, whereas expanding it at the leeward
side, which gradually fades into space. The windward extent of the upper
exosphere is about 57000 km. Here the magnetic field fluctuates erratically.
During intense solar activity (sunspots and flares), the solar wind
can play havoc with Earth's magnetic field, causing bright auroras and
magnetic storms that upset magnetic compasses, electronic equipment and
long power lines. The year 2001 is expected to be at the height of both
the 20 year and the 10 year sunspot cycle. It takes 4 days for the solar
wind to arrive here, enough to take preventative action in case of extreme
outbursts.
Artificial satellites Since Russia took the world by surprise with its Sputnik
I satellite (4 Oct 1957), there has been a race for space. The number of
satellites launched, is astounding (and some are kept secret). At first,
satellites provided an extension of the armament race between the USA and
USSR but later, other types were launched:
Experimental satellites were used to test the technology
of space exploration: launching, guidance, control, positioning, living
in space and so on.
Spy satellites helped the super powers to spy on each
other:
Reconnaissance photography: taking detailed photographs
of strategic areas. (secret)
Listening: tapping sensitive communications. Various
ground stations all over the world were needed. (secret)
Nuclear test and missile launch detection. (Vela,
SDI)
Communication satellites improved communications:
Experimental: to test new instrumentation and frequencies.
(Score, Echo, Application Technology Satellites ATS)
Military communications: to connect military units.
(secret)
Civilian repeaters: telephone, television. These satellites
were mostly placed in geostationary orbit (35700 km). At the end of the
1970s, more than 60% of all international telephony was routed through
satellite. A signal travelling at the speed of light (300,000 km/s) would
take about 0.27 seconds to travel up and down, a most noticeable delay,
which can become annoying for telephone conversations if relayed through
more than one satellite. New optical fibre cables between continents have
now replaced most satellite telephone, but not all Internet traffic. For
one-way television broadcasting, satellites are still superior. (Echo,
Telstar, Syncom, Intelsat)
Civilian mobile phone: The Iridium network of low
orbiting satellites was designed to connect people all over the world on
a personal basis, but interest was insufficient to make it work. Iridium
went bankrupt in 1999.
Elliptical orbit satellites: in order to provide communication
over Russia, being located too far north for geostationary satellite coverage,
the USSR launched three satellites in highly elliptical orbits between
480 and 39420 km, in such a way that at least one looks down over Russia
at any time of day. (Molniya)
Navigation satellites improved world navigation.
The US military Global Positioning System (GPS) with
its many polar low orbiting satellites, was designed to provide accurate
positioning and weapons targeting. For civilian use, the signal incorporated
a deliberate error to make it useless for weapons guidance. But in early
2000, the error signal was removed, rendering it much more accurate for
civilian use. (Transit, GPS)
Radar- and laser-reflective balloons were launched
to enable geologists to better determine the distances between continents.
It also helps to detect crust movements that may cause serious earthquakes.
(Lageos)
Scientific satellites helped scientists to extend
their knowledge considerably.
Weather satellites provide infrared
and radar maps of cloud formations, improving weather forecasts considerably.
(TIROS, SMS, Meteosat, NOAA, Nimbus, ESSA, Meteor, GEOS)
Space telescopes were launched to look away from Earth
into space in all possible wavelength from radio, infrared, visible, to
X-rays and gamma rays. The Hubble telescope provides very detailed images.
New discoveries are made almost weekly.
Earth observing satellites look towards Earth with
instruments in all possible wavelenghts. Passive instruments look at radiation
coming from the atmosphere and surface, whereas active instruments (radar)
send a signal and measure the returned proportion. In the past few years,
enormous progress has been made, enabling scientists to look at every aspect
of the planet. (Seasat, ERTS, Landsat, GOES, GARP, GMS, GOES, GEOS)
Space exploration satellites (space probes) were sent
on missions to explore the solar system. Some were sent to orbit planets,
some to land and take measurements, some to travel through space, some
to explore comets. (Ranger, Surveyor, Lunar Orbiter, Venera, Mariner, Viking,
Pioneer, Voyager, Vega, Giotto, Magellan, Galileo,)
Manned spacecraft made complicated missions possible
through highly trained astronauts
Experimental: to explore the technology of manned
space flight. (Vostok, Mercury, Gemini, Soyuz, Columbia)
Moon landers: to explore the surface of the moon.
(Apollo)
Space shuttle: to place payloads into space, recover
low orbiting satellites, make repairs and so on. (Columbia, Space Shuttle,
Buran)
Space stations: to study the effects of space habitation,
to do long-term experiments. (Salyut, Mir, Skylab)
Most satellites are launched close to the equator in
an easterly orbit, where they benefit from the rotational speed of the
Earth's surface, about 450 m/s (1620 km/s). Most earth observing satellites
have polar orbits, so that they can travel over all parts of the world,
as the world turns beneath them.
In order to stay in orbit, a satellite must balance its
centrifugal force with the pull of Earth. Close to the Earths surface,
this speed is high, but further away, as the pull of gravity decreases,
this speed reduces accordingly, as shown in the table. The speed required
to escape the pull of Earth altogether, is 11.2 km/s (40320 km/hr). In
low orbits, a satellite experiences friction with the thin atmosphere,
slowing down and burning up in only a few years. For practical service,
a satellite must orbit higher than 400 km.
Orbit Low orbit
Medium orbit
Geostationary
Moon
Height km
200
1730
35900
386000
Velocity km/h
29000
25400
11300
3700
Rotation
90 min
120 min
24 hr
28 days
The velocity of any Earth orbit can be calculated from:
v = SQR( 400E12 / r) (See units/force
table).
For low orbit 200 km, r = 6300+200= 6500 km = 6.5E6m
v= SQR(400E12 / 6.5E6) = 7847 m/s = 28240 km/h
rotation t = 2 x pi x r / v = 1.45 h = 87 min
Update Jan 2014 More than 5,000 satellites have been launched into orbit
since the space age began. Today, eleven countries have space launch capability,
with over sixty countries operating about 1,100 active satellites orbiting
the earth providing a constant stream of data and information relied upon
for critical civilian communications as well as for military operations
http://satellitedebris.net/Database/LaunchHistoryView.php
Solar radiation The
sunlight, as it arrives on Earth's atmosphere, almost perfectly matches
what is expected of the theoretical radiation from a blackbody of 5780
degrees Kelvin. A blackbody is an idealised mass which is so black that
it completely absorbs all radiation falling onto it and also that it radiates
out as defined by various laws in physics (Stefan, Boltzmann, Planck, Wien).
The diagram tries to simplify the confusing situation. The sun's light
(yellow shape), delivers its energy mainly in the visible light wavelengths,
from ultraviolet to near infrared (0.3-3 micron), peaking at 0.5 micron
(blue-green colour). Although much of it is reflected back to space, the
remaining light is converted to heat and radiated out by the Earth's surface
(green shape). These wavelengths are in the far infrared range (5-25 micron),
peaking at 11 micron. Note that absorption by water is a rather influential
factor, causing daily, seasonal and latitudinal (N to S) differences in
the measured and averaged radiation curves. The grey
shapes show the way natural greenhouse gases filter both the incoming and
the outgoing radiation (some curves are incomplete).
The
resulting incoming radiation on the surface and the outgoing radiation
in space, look rather confusing, as they are filtered both ways. In the
diagram on right, actual radiation is shown but with logarithmic scales.
From the shape of Earth's outgoing radiation, the planet behaves like a
blackbody at -18ºC rather than the average surface temperature of
+15ºC.
It is interesting to note that the most abundant
atmospheric gas, nitrogen (N2), plays an insignificant role, but the gases
that are made by life on Earth, do the work. They filter out harmful ultraviolet
radiation (less than 0.3 micron) and they maintain a warming blanket that
raises the temperature of the surface from -60ºC, what it would have
been without an atmosphere, to +15ºC. They keep the planet habitable.
The
diagrams shown before would be quite meaningless without understanding
what solar radiation means to life. This diagram shows in the top half
what we've seen before, the solar radiation reaching the atmosphere and
what filters through it to sea level. The vertical scale is linear and
the horizontal log scale not quite logarithmic, but it shows what the light
looks like, just under the sea surface (light blue) (See also UW
photography/water/colour). Notice that both the quantity and quality
of the light have changed dramatically. The blue sky is caused by blue
light bouncing off air molecules and its spectrum is shown here (dark blue),
as well as the spectrum underneath a plant canopy, when plants have been
filtering their needs out (green). These two qualities of light play havoc
with a photographer's settings and are quite often misunderstood. Note
that if an object absorbs light of one part of the spectrum, it reflects
the remaining light. Thus a plant which absorbs blue light, looks red.
The bottom graph projects the absorption curves of photosynthetic compounds
necessary for photosynthesis. Plants capture the energy from the sun by
means of a special pigment that turns a light photon into a chemical work
unit (electron). What is not directly obvious is that towards the left
of the graph, light photons become more energetic. Thus a purple photon
(wave length 0.4) is nearly twice as energetic as a red photon (wave length
0.7), and can do more work. A UV-B photon (wave length 0.25) is more energetic
still. During the course of evolution, plants evolved from photosynthesising
bacteria (blue-green algae). At the time there was no atmosphere and the
amount of UV-B radiation that must have existed, made terrestrial life
a death warrant. Notice how bacterio-chlorophyll has its absorption peak
towards the red. Modern plants use chlorophyll and beta-carotene, as well
as the other substances shown.
This
diagram shows how sunlight is distributed over the planet by latitude,
going from the North Pole (left) to the South Pole (right), and in what
proportions it is reflected back to space and absorbed by the planet. As
can be expected, most sunlight falls in mid latitude, around the equator.
The amount absorbed by the surface, depends mainly on what grows on the
surface, green plants absorbing most. The amount absorbed by air (blue
shape) follows a fixed proportion of the incoming radiation, but the part
reflected by clouds (white) brings a surprise, mainly because of dense
cloud cover in the temperate regions. Reflection by the surface is highest
at the poles, but by Antarctica more than the arctic. Also deserts at around
30 degrees, reflect the light.
The combined effects of radiation, reflection, latitude, season, vegetation
and the sizes of the land masses, causes the continents and the oceans
to warm and cool, producing winds and currents.
Also visit the CNES (Centre Nationale des Etudes
Spatiales) Resources
in earth observation web site for the theory of atmospheric principles,
satellite observing, etc. More details also in the chapters on Soil
and Global climate.
Air circulation From
the previous chapter it is clear that the equator warms up much more than
the poles. The global wind circulation would simply have consisted of warm
air rising at the tropics, travelling south and descending at the poles;
cool wind travelling over the surface back to the tropics. The picture
shows that the situation is more complicated, mainly because the Earth
rotates and because warm air contains moisture. The amount of heat carried
by moisture is unexpectedly large because water requires an enormous amount
of heat to evaporate - heat which is released again when water condensates.
Another important factor is that air is compressible, heating up when compressed
while cooling when expanding. The picture on right tells the story of how
air circulates around our planet.
Starting at the tropics, we find warm air, loaded
with moisture, indeed rising (tropical Hadley Cells). Over the tropics,
the effect of the rotating earth (the Coriolis force) is least. Warm air
climbs, cools, loses its moisture (tropical rains) and travels south some
distance. At about 30 degrees latitude the dry air descends (because it
has cooled and because of the Coriolis force), compresses and warms up
to form deserts on land and calm areas at sea (the doldrums). Curving slightly,
winds return to the tropics as trade winds. Notice that the speed of up
and down drafts (0.05-0.1 m/s) is 100 times less than that of horizontal
winds (10-20 m/s). Imagine the Hadley Cells and surface winds as spiralling
north and south of the equator.
Between latitude 30-60 degrees, the Coriolis force
is felt strong enough to cause winds to rotate horizontally as wandering
cyclones and anticyclones. In the northern hemisphere, winds are deflected
to the right, which makes them rotate clockwise around anticyclones (H)
and anti-clockwise around cyclones (L). On the southern hemisphere, the
situation is the reverse.
On average the barometric pressure above 30º
latitude is high and low towards 60º. Between the high and low pressure
bands, winds mainly move in an easterly direction (temperate westerlies,
'roaring forties'). Towards the poles, the winds move mainly in westerly
direction (polar easterlies, 'screaming sixties'). At high altitude (9-15
km) in the down draft of the tropical Hadley cells, above the desert regions
(at 30-40º latitude), runs a strong westerly wind (the jet stream)
which is very focused (several hundred km wide) and which flows fast (200-300
km/hr). It is trapped in the frontal zone between polar and tropical air
(see diagram below). The jet stream does not run around the world as a
continuous ribbon but it interconnects weather systems, flowing fast in
winter (100-200 km/hr) but much slower in summer (30-80 km/hr). (From
R G Barry & R J Chorley: Atmosphere, weather & climate. 1982)
At the poles, air rises and descends by convection
in the polar Hadley Cells. Coriolis deflection turns this into spiralling
movements around the poles.
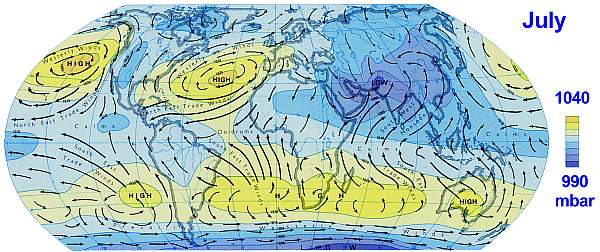
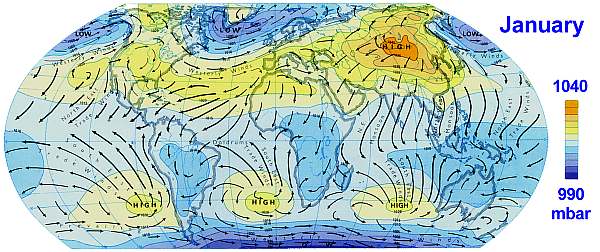
The presence
of continents and seasons, complicates the pattern further, as can be seen
from the maps below. As the earth tilts from summer to winter, the heat
equator moves from 23.5 degrees south to 23.5 degrees north and back, passing
over the true equator twice. It gives places around the equator four seasons
(monsoons) and everywhere else two (summer/winter). Note that monsoons
develop only where large continents border an ocean.
The top map gives the situation in the northern
summer, whereas the bottom map pictures the southern summer.
Both the winds and the high/low pressure areas are of course averages
for each season, obscuring the enormous variations from day to day. Wherever
the wind blows over the sea, a surface current is induced. In places where
the wind blows from the same direction in all seasons, sea currents can
develop to great depths (to 200m deep) and high speeds (up to 2 km/hr).
See if you can predict from these maps, where the main ocean currents can
be expected.
(Maps sourced from: The New Zealand University Atlas,
George Philip & Sons. 1979)
Heat
transport Heat is tranported from the equator to the poles by ocean gyres and
wind (with moisture). As a rule of thumb, about one third is done by the
ocean currents and two thirds by the atmosphere. Compare the areas under
the blue and red curves above the zero line. Total heat transport is maximal
where the temperature gradient is maximal, at mid latitudes (30-50º).
Ocean currents are more effective in the subtropics (10-40º), whereas
the atmosphere is more effective at higher latitudes (30-70º). Note
that heat transport by air is not done by the air itself, which has a very
low heat capacity, but by successive evaporation and precipitation. As
warm ocean water moves from the tropics northward, it enters a cool atmosphere,
resulting in high evaporation and rain, until the ocean has cooled completely.
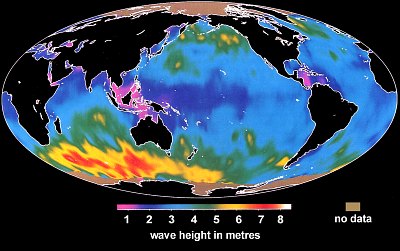
Wave
height Although early seafarers gave account of parts of the oceans without
any wind (the doldrums, dark blue areas) and other parts with never ending
storms and towering waves (yellow-red areas), nobody really had any idea
of the average height of the waves in all oceans. The noise level on early
satellite maps of the height of the sea surface gave some indication, but
it wasn't until 1992 that the TOPEX/Poseidon satellite gathered data by
bouncing radio waves off the surface of the ocean and the reflected signals
were analysed. The picture on right emerged. It shows that the ocean around
the equator is generally calm (purple/blue), with very calm regions in
between the archipelagos of Indonesia and the Caribbean, because there
is not enough wind fetch to create high waves. Surprisingly, an
area exists south of the Indian Ocean, where waves average up to
7m in height (yellow/red)! In this area, winds consistently blow eastward,
which gives them an unequalled fetch on the ocean's water. This
area may well be the power house behind the South Pacific Gyre, which by
its El Niño and La Niña cycles, has a major influence on
all climate of the planet.
 Because
the circulation of water and air depend on the amount of heat arriving
at the planet's surface, it is important to understand what happens to
the sunlight from the moment it enters our atmosphere. This simple picture
helps to relate the relative distances involved. If the planet were the
size of a billiard ball, say 5 cm across, then the whole surface of the
planet, from Mt. Everest to the deepest ocean trough (20 km) would be no
thicker than a human hair. Here is where everything happens to life (the
biosphere). Within this human hair, there are at least two layers in the
atmosphere and two in the ocean that move almost independently of one another.
Because
the circulation of water and air depend on the amount of heat arriving
at the planet's surface, it is important to understand what happens to
the sunlight from the moment it enters our atmosphere. This simple picture
helps to relate the relative distances involved. If the planet were the
size of a billiard ball, say 5 cm across, then the whole surface of the
planet, from Mt. Everest to the deepest ocean trough (20 km) would be no
thicker than a human hair. Here is where everything happens to life (the
biosphere). Within this human hair, there are at least two layers in the
atmosphere and two in the ocean that move almost independently of one another.
 In
the diagram, the various zones are shown. Note that their boundaries vary
appreciably from pole to equator and from day to night. The outer zone
is the exozone which gradually fades into space. At 600 km the pressure
is a mere 1E-38 bar or less than a trillionth of a trillionth of a trillionth
of surface pressure. Only the fastest atoms of the lightest gases, Hydrogen
and Helium are found here.
In
the diagram, the various zones are shown. Note that their boundaries vary
appreciably from pole to equator and from day to night. The outer zone
is the exozone which gradually fades into space. At 600 km the pressure
is a mere 1E-38 bar or less than a trillionth of a trillionth of a trillionth
of surface pressure. Only the fastest atoms of the lightest gases, Hydrogen
and Helium are found here.
 The
sunlight, as it arrives on Earth's atmosphere, almost perfectly matches
what is expected of the theoretical radiation from a blackbody of 5780
degrees Kelvin. A blackbody is an idealised mass which is so black that
it completely absorbs all radiation falling onto it and also that it radiates
out as defined by various laws in physics (Stefan, Boltzmann, Planck, Wien).
The diagram tries to simplify the confusing situation. The sun's light
(yellow shape), delivers its energy mainly in the visible light wavelengths,
from ultraviolet to near infrared (0.3-3 micron), peaking at 0.5 micron
(blue-green colour). Although much of it is reflected back to space, the
remaining light is converted to heat and radiated out by the Earth's surface
(green shape). These wavelengths are in the far infrared range (5-25 micron),
peaking at 11 micron. Note that absorption by water is a rather influential
factor, causing daily, seasonal and latitudinal (N to S) differences in
the measured and averaged radiation curves. The grey
shapes show the way natural greenhouse gases filter both the incoming and
the outgoing radiation (some curves are incomplete).
The
sunlight, as it arrives on Earth's atmosphere, almost perfectly matches
what is expected of the theoretical radiation from a blackbody of 5780
degrees Kelvin. A blackbody is an idealised mass which is so black that
it completely absorbs all radiation falling onto it and also that it radiates
out as defined by various laws in physics (Stefan, Boltzmann, Planck, Wien).
The diagram tries to simplify the confusing situation. The sun's light
(yellow shape), delivers its energy mainly in the visible light wavelengths,
from ultraviolet to near infrared (0.3-3 micron), peaking at 0.5 micron
(blue-green colour). Although much of it is reflected back to space, the
remaining light is converted to heat and radiated out by the Earth's surface
(green shape). These wavelengths are in the far infrared range (5-25 micron),
peaking at 11 micron. Note that absorption by water is a rather influential
factor, causing daily, seasonal and latitudinal (N to S) differences in
the measured and averaged radiation curves. The grey
shapes show the way natural greenhouse gases filter both the incoming and
the outgoing radiation (some curves are incomplete).  The
resulting incoming radiation on the surface and the outgoing radiation
in space, look rather confusing, as they are filtered both ways. In the
diagram on right, actual radiation is shown but with logarithmic scales.
From the shape of Earth's outgoing radiation, the planet behaves like a
blackbody at -18ºC rather than the average surface temperature of
+15ºC.
The
resulting incoming radiation on the surface and the outgoing radiation
in space, look rather confusing, as they are filtered both ways. In the
diagram on right, actual radiation is shown but with logarithmic scales.
From the shape of Earth's outgoing radiation, the planet behaves like a
blackbody at -18ºC rather than the average surface temperature of
+15ºC.
 The
diagrams shown before would be quite meaningless without understanding
what solar radiation means to life. This diagram shows in the top half
what we've seen before, the solar radiation reaching the atmosphere and
what filters through it to sea level. The vertical scale is linear and
the horizontal log scale not quite logarithmic, but it shows what the light
looks like, just under the sea surface (light blue) (See also
The
diagrams shown before would be quite meaningless without understanding
what solar radiation means to life. This diagram shows in the top half
what we've seen before, the solar radiation reaching the atmosphere and
what filters through it to sea level. The vertical scale is linear and
the horizontal log scale not quite logarithmic, but it shows what the light
looks like, just under the sea surface (light blue) (See also  This
diagram shows how sunlight is distributed over the planet by latitude,
going from the North Pole (left) to the South Pole (right), and in what
proportions it is reflected back to space and absorbed by the planet. As
can be expected, most sunlight falls in mid latitude, around the equator.
The amount absorbed by the surface, depends mainly on what grows on the
surface, green plants absorbing most. The amount absorbed by air (blue
shape) follows a fixed proportion of the incoming radiation, but the part
reflected by clouds (white) brings a surprise, mainly because of dense
cloud cover in the temperate regions. Reflection by the surface is highest
at the poles, but by Antarctica more than the arctic. Also deserts at around
30 degrees, reflect the light.
This
diagram shows how sunlight is distributed over the planet by latitude,
going from the North Pole (left) to the South Pole (right), and in what
proportions it is reflected back to space and absorbed by the planet. As
can be expected, most sunlight falls in mid latitude, around the equator.
The amount absorbed by the surface, depends mainly on what grows on the
surface, green plants absorbing most. The amount absorbed by air (blue
shape) follows a fixed proportion of the incoming radiation, but the part
reflected by clouds (white) brings a surprise, mainly because of dense
cloud cover in the temperate regions. Reflection by the surface is highest
at the poles, but by Antarctica more than the arctic. Also deserts at around
30 degrees, reflect the light. From
the previous chapter it is clear that the equator warms up much more than
the poles. The global wind circulation would simply have consisted of warm
air rising at the tropics, travelling south and descending at the poles;
cool wind travelling over the surface back to the tropics. The picture
shows that the situation is more complicated, mainly because the Earth
rotates and because warm air contains moisture. The amount of heat carried
by moisture is unexpectedly large because water requires an enormous amount
of heat to evaporate - heat which is released again when water condensates.
Another important factor is that air is compressible, heating up when compressed
while cooling when expanding. The picture on right tells the story of how
air circulates around our planet.
From
the previous chapter it is clear that the equator warms up much more than
the poles. The global wind circulation would simply have consisted of warm
air rising at the tropics, travelling south and descending at the poles;
cool wind travelling over the surface back to the tropics. The picture
shows that the situation is more complicated, mainly because the Earth
rotates and because warm air contains moisture. The amount of heat carried
by moisture is unexpectedly large because water requires an enormous amount
of heat to evaporate - heat which is released again when water condensates.
Another important factor is that air is compressible, heating up when compressed
while cooling when expanding. The picture on right tells the story of how
air circulates around our planet.