The Dark Decay Assay (DDA) for aquatic plankton ecosystems by Dr J Floor Anthoni
First published: January 2005; On web: 10 Aug 2005.
Since the discovery of the missing ecological
factor in the sea, the planktonic decomposers, and the formulation of the
Plankton
Balance hypothesis, the search continued to measure and quantify the
two most important components of planktonic ecosystems, the phytoplankton
and the decomposers. This led to the discovery of a new procedure that
enables anyone to measure the most important plankton characteristics using
a simple pH meter. The DDA has opened a new window of interest on aquatic
ecosystems, discovering new environmental laws in the process. This document
describes the ideas behind it, methods used and results obtained. From
necessity, the examples used are all from New Zealand.
.
Important notice! The information provided
here is NOT in the 'Public Domain' and remains the intellectual property
of Dr J Floor Anthoni. By using the described methods, you may infringe
copyrights unless being registered. Please read the conditions of use and
how to register (register.htm). Also please
note that the documents provided here are 'living' documents, being updated
from time to time.
An introduction into the history of the discovery of the missing ecological
factor, the Plankton Balance hypothesis and the Dark Decay Assay. Principles
behind the method, results and more. (16 pages, this document)
Rather than measuring physical quantities, the DDA measures the interaction
between the most important components of plankton ecosystems. It measures
the health of the aquatic environment. As a result, it overturns much of
our thinking. (on this page)
This chapter begins from the beginning, assuming you know little or
nothing at all about ecosystems, the sea and degradation. Also for people
who have little time, read this first. (10 pages)
Many tests have been performed to improve the accuracy of the DDA and
to understand how it works. Using simple tests, the DDA has been verified
but more needs to be done. A history of how the DDA developed. Fascinating
and revealing. (18 pages)
A list of people, institutions, businesses and community groups who
wish to be networked. (1 pages)
marine studies
Studies made with the DDA in the marine environment, supported by further
experimentation.
Note! for best printing results, narrow the page margins
to 0.3" and 0.2" and top/bottom to 0.4"
Mapping the sea (1): mapping
biodensity & RoA around Northland, New Zealand, Feb-May 2005.
(10 pages)
_
freshwater studies
Studies made with the DDA in the fresh water environment. Because freshwater
plankton ecosystems are more stable and less complex than their marine
counterparts, new insight is gained.
fresh01.htm: Seasonal studies
of Rotorua, Waikato and Northland freshwater lakes (10 pages, growing)
_
aquariums
The marine aquariums at the Seafriends field centre in Leigh are based
on a self-circulating ecosystem. As a result, the degradation happening
in the sea has been experienced there too. With the DDA technique these
aquariums are now being prograded and this reverse process gives new insight
about degradation and indicator species. Interesting and challenging. (
in progress)
aquarium description (aqua1.htm):
a description of the Seafriends ecosystem aquariums, how they work, how
they are managed and how they are prograded. (10 pages)
aquarium species (aqua2.htm):
an annotated list of species and how well they fare now compared to before.
(9 pages)
progradation timeline (aqua3.htm): an annotated timeline
of events and observations, with photos. (in progress)
_
further research
The (simple and exploratory) research done so far can only open a view
to further possibilities, many of which require extensive instrumentation
and scientists in many different scientific disciplines. Here is a wish
list of what could be done next. It also gives you an insight into the
limitations encountered so far. (postponed)
related chapters
Supporting documents: documents found elsewhere
on this web site.
principles of conservation:
resource management, biodiversity, conservation principles, marine conservation,
marine reserves and much more (a very large section and important reading).
principles of degradation:
the coastal seas are degrading precipitously. Why is this happening, and
why is it happening so fast? Why also in New Zealand and why now? What
are the principles behind it? (27 pages)
the Plankton
Balance Hypothesis: the most important ecological factor affecting
marine life has been overlooked. Plankton does not only feed but it also
kills by means of its decomposers which pose a health threat to all marine
organisms. (16 pages)
examples of degradation:
a section with photographic examples of what degradation looks like (16
pages, growing)
For comments and suggestions, please e-mail
me, Dr Floor Anthoni.
Reader please be aware that the information provided
in this section is entirely new work that has not been confirmed yet by
conventional science. It is therefore not suitable yet for teaching. Readtips
for printing.
-- seafriends home -- DDA
index -- plankton index
-- decay index --
Rev 20050201, 20050630,20050810,20050830,20051008,20080703,
Introduction The Dark Decay Assay method may well be the culmination of a personal
quest to understand and mitigate the problems in our aquatic environments.
It began in 1990 when I decided to devote the remainder of my life towards
saving
our seas. But this cannot be done without understanding precisely
what is wrong with it and how degradation works. One cannot prescribe
an effective cure without thoroughly examining the patient. My dogged
pursuit led to several discoveries, all documented on the Seafriends web
site. But the discovery of the missing ecofactor, the planktonic decomposers,
followed by a simple method to measure them, may well rank amongst the
most important discoveries in recent times, changing the way we think about
the sea and hopefully giving us the insight to reverse the declining situation.
For over 40 years now I have been keenly observing the marine environment
while taking underwater movies and later, still pictures. These gave me
a kind of registration from which I learnt more as I viewed them again.
It allowed me to discover the ill effects of degradation at an early stage
(1987), which urged me to devote my life to this matter in 1990. Because
degradation has far-reaching ill effects on nearly all species, I had to
rely on observation alone to further my understanding. This led to so many
paradoxes that I concluded that an important ecological factor (like sunlight,
wave action, nutrient level, etc.) had been overlooked.
It
didn't take long to discover that this had to be the planktonic decomposers
consisting of bacteria, fungi and viruses. These living organisms are so
small that they occupy the pico- and femto-plankton,
invisible to the optical microscope. What people had overlooked is that
the food chain is not all the service that plankton delivers, but
it also contains potent decomposers that recirculate the nutrients from
wastes and dead bodies. Their task is to break dead biomatter apart, thereby
consuming the last of its solar energy, as nutrients contain no such energy.
Enthusiastically these decomposers will also attack living organisms such
that living in the sea depends on a precarious balance - the Plankton
Balance that feeds but also kills. Even those organisms not depending
on plankton for food, still need to breathe it, and even marine mammals
who do not breathe it, are bound to be affected.
The diagram shows the plankton ecosystem. Phytoplankton (producers, green)
convert sunlight into biomatter using nutrients dissolved in the water.
The phytoplankton is eaten (grazed) by the zooplankton which is in turn
eaten by larger predators, which forms the food chain in its many stages,
not shown here. All dead biomatter is recycled by the planktonic decomposers
(brown) while larger parts sink to the sea soil where they are decomposed
by the benthic (bottom) decomposers. Both kinds of decomposers return dissolved
nutrients to the water, thereby closing the cycle. The planktonic decomposers
play a large role because of the high turnover rates in the first stages
of the food chain.
The organisms most affected by the decomposers are those taking part
in the plankton, particularly the producers or phytoplankton. It was then
that I realised that a kind of arms race between the two main guilds, the
producers and the decomposers can have a selective influence on both. Such
an arms race can be initiated by overfeeding (eutrophication) as is now
common in all coastal seas. As the decomposers (the attackers) become more
aggressive, the producers (phyto plankton, the defenders) become more defensive
as the hardy species replace the sensitive ones. This in turn selects for
even more aggressive attackers, and so on. As the phytoplankton becomes
more hardy, it also becomes less digestible as at the same time the decomposers
become more deadly. Thus the Plankton Balance within the plankton
can shift profoundly from powering the food chain (powerplankton)
to powering the decomposers while becoming a threat to all other marine
organisms (killerplankton), as if the sea were eating itself!
This agrees with the environmental degradation symptoms I have been observing.
I postulated that the health of the sea, particularly where eutrophication
reigns, depends almost entirely on the decomposers (while not ignoring
sedimentation), and that a method for measuring these was needed.
Decomposition connects all
trophic levels in an ecosystem - Floor Anthoni
Measuring
the decomposers By simplifying the planktonic ecosystem to the diagram shown here,
it was realised that only a pH meter could measure the biomatter (or energy)
flows, as the densities of phytoplankton are very low indeed. The producers
(green arrow) photosynthesise (put together by means of energy from light)
chains of living matter containing many hydrogen bonds, and therefore scavenge
hydrogen ions from the water: the pH increases as hydrogen ions become
scarcer. The foodchain (orange arrow) consumes the living matter and oxygenates
it: the pH decreases somewhat. Finally the decomposers break the remaining
hydrogen bonds, thereby returning hydrogen ions to the water: the pH decreases
as hydrogen ions become more numerous.
Simplistically thought, a high pH is healthy whereas a low pH is not.
However, this is not quite borne out by measurements as the system is more
complicated.
Note the orange side loop, thought necessary in case phytoplankton
respires at night, is of minor concern. But the brown side loop, which
feeds phytoplankton direct to the decomposers, can become rather influential.
Birth
of the Dark Decay Assay Taking the pH of sea water is disappointing as the resulting values
do not correspond with the quality of the water such as turbidity, colour
and smell. In the map for instance, measurements were done in the Manukau
Harbour (New Zealand) where most of Auckland's treated sewage is discharged.
As heavy nutrient loads overfertilise the water, the phytoplankton blooms
at maximum density, which decreases towards the harbour mouth where the
water is visibly much clearer, but this is not borne out by the pH of the
water (see inset map).
It then occurred to me that the producers should be disabled and 'fed'
to the decomposers and the process followed in a sealed container to keep
all reagents inside. By placing the test vials in the dark, the decomposers
would immediately cease their activity and eventually die, to be decomposed.
In the process H+ions (hydrogen ions) are released and these can
be measured accurately. The graph shows how in curve A the plankton decomposes
very rapidly (beginning slope) whereas its total biomass (end of decomposition)
is no different from curve B. At the very mouth of the harbour, point D
the decomposers are less active as also biomass density (biodensity) is
less. A high tide rock pool (E) contains water with similar density as
A and B but beginning with a very high pH. It was later discovered that
long-lived algae excel in scavenging hydrogen ions, thereby pushing the
pH up high.
It was surprising that the curves showed so much latent or chronic
decomposition, even when the phytoplankton should still be alive, later
recognised as a sure sign of sick plankton.
Note that we assumed that the released hydrogen ions are a proxy for
(representative of) biomass (measured as hions), something that
needs further confirmation. Note also the logarithmic nature of the pH
scale where decomposed biomass increases steeply down the graph as a step
from 8 to 7 represents a tenfold increase.
Powerplankton While using the DDA to get a feel for what it is capable of, also a
coastal area was sampled, which usually has clear water, near Cape Brett,
New Zealand. Travelling over a patch of water with a different smell, a
sample was taken (R) which subsequently showed to consist of a peculiar
plankton assemblage. For about one day and a half, no latent or chronic
decomposition was measured, followed by decomposition occurring so
fast that most of it was missed. As the curves are not caused by artefacts,
it must be assumed that this 'suicide' is a special adaptation of the plankton
assemblage, perhaps to retain nutrients in the photic (light-) zone. But
it is also bound to make this type of plankton better digestible, as no
pickings remain for the decomposers (proved by the flat curve at the beginning).
This powerplankton thus transfers the solar energy almost completely
into the food chain without threatening health. It could well be that this
powerplankton
powered the once bountiful coastal fisheries. Unfortunately it has now
become rare, reason perhaps for collapsing fisheries world wide. It is
possible that the disappearance of the powerplankton is the first sign
of degradation, happening at around 12-15m visibility. One day perhaps,
satellites may recognise this kind of plankton.
Improving the method Once the DDA had shown its promise, we concentrated on making it more
accurate, as it can easily suffer from loss of hydrogen ions during the
short periods of measurement. We also explored temperature stabilisation
because the Rate of Attack (the beginning slope) depends on the
biological activity of microorganisms, and thus on temperature. Eventually
we settled for an accelerated temperature of 27ºC as the ideal incubation
temperature. We also minimised the number of measurements, such that the
nature of the decay curve is preserved with minimal loss of hydrogen ions
to the air. With these improvements in place, measurements could now be
compared from place to place and time to time, as also the whole DDA incubation
is completed within two weeks.
Here
is an example of a 250km round-trip in the outer Hauraki Gulf, New Zealand.
The distance between points I and M is about 40 nautical miles (75 km).
M is located at the territorial boundary which also marks the edge of the
continental shelf. The graph shows measured pH vertically and days incubation
at the standard temperature of 27ºC. The red rectangle is a movable
window of 48 hours to measure the 48 hour Rate of Attack from the drawn
curves. Note that decomposed biomass (H+ion proxy or hions) increases
downward with decreasing pH. Note how the initial pH always climbs towards
the end of the day, due to producer activity opposing that of the decomposers.
Note that the total decomposed biomass at day 13 shows only small differences
between sites. Highest density (lowest final pH) is D inside a small harbour
whereas lowest density (highest final pH) is M. Although M has a noticeably
smaller biomass, it also has the lowest Rate of Attack (5) in 48
hours. Conversely, D has the highest RoA (15). These measurements
were taken at the end of summer (16 April) when the waters clear up as
their nutrients have been consumed and blue water mixes with the coastal
water. Even so, it was an unusually murky year with water clarity ranging
from 4m (D) to 29m (P). All sites suffered from chronic decay. These
results have also been mapped in the coastal map below.
Mapping
the health of the sea The map shows the northern part of the North Island (New Zealand),
with the city of Auckland straddling its narrowest part. Here the sewage
of 1 million inhabitants finds its way to the sea. On the West Coast, the
Waikato River flows into the sea, infused with fertiliser and excrement
from stock and people from a large area of land to the south of this map.
Not surprisingly, the (green) values for biomass density are very high
here and with these the bacterial activity or chronic Rate of Attack
(RoA). Inside the Manukau Harbour where the main sewage works are located,
the RoA may reach values of 69, which are not conducive to rich
life (even oysters and cockles die), but even at its mouth very high values
are found (51), just tolerated by mussels. Notice that RoAs should be interpreted
with care because of the possible arms race between decomposers
and producers. A low RoA on hardy phytoplankters may mean a high RoA on
more sensitive species. As a guideline, consider RoA<20 as healthy,
20-40 as sick and >40 as killer plankton.
Following the West Coast northward, one comes across a patch of low
RoA which shows how a tongue of blue water from the north lays over the
more aggressive green-brown water from the south.
Whereas the west coast is characterised by dirty waters, the east coast
is usually clear, with 10-20m viz. However, surprises abound as RoA stays
high in many places. Furthest out lies the Poor
Knights Islands marine reserve where very high biomass densities and
Rates of Attack (45/303) were found. Closer investigation showed a concentration
of biomass near the surface, with very high bacterial activity. It explained
why we saw much degradation happening in the shallows, whereas such shallows
are usually exempted along the coast, due to the intensity of the waves
that cleanse it, and more thorough mixing of the water.
In
order to better understand the data in the above map, memorise the diagram
shown here, plotting phytoplankton density (green) and decomposer density
(orange) on a linear scale (but logarithmic visibility scale). It shows
how the phytoplankton reaches a maximum between 4-5m viz. It also
shows how the decomposers can increase suddenly between 11-9m viz.
The resulting rate of attack (RoA), however, is more erratic but follows
an average according to the red curve.
To focus your thoughts while browsing the map, imagine a hion
density of less than 60 as healthy, 60-90 as sick and above
90 as killerplankton, even though this has not been proved conclusively.
Note that biodensity and RoA must be considered together.
Remember also that the map is but a snapshot in time, taken in the
autumn period between March and May 2005 when the water becomes clear (and
healthier?). Note also that the new technique of alcohol enhancement
will find different biodensity values as it also decomposes the slush
in the sea.
Note how the inner Hauraki Gulf misses its RoA values (red) because
measurements were done at an unknown ambient temperature. However the green
values for biomass density are accurate.
The data for maps like these can now be collected by conscientious
amateurs equipped with a small and low-cost portable laboratory costing
no more than $500. Their results can be poured into a national database
with Internet access such that a finger can be kept on the pulse of the
sea. Local care groups now have a tool to monitor the health of their aquatic
ecosystems, a tool that also allows them to monitor the results of their
actions and the origins of eutrophication.
Biodensity
and visibility Wherever possible, we also measured the clarity of the water by a modified
Secchi
disc method as this provides another means of verifying the data. In theory
the data points for hion biomass should lie along two straight lines
marking the reciprocal relationships between visibility and phytoplankton
biomass. Vertically the hion density calculated by subtracting the
initial pH value from the final pH value (by proper anti-log conversion)
and then plotting it again logarithmically. So it resembles the logarithmic
pH scale very much.
The right-hand line marks the nutrient-limited region where visibility
increases proportionally as density decreases. The lef-hand line marks
the light-limited region where the sunlight can maintain proportionally
less
biodensity if the visibility decreases (but depth also plays
a role). Note in this respect that the DDA does not measure nutrient concentrations,
but only their effects on planktonic life. Note also that the graph maps
plankton densities rather than the total amount of plankton found in the
sea. Ironically, as the water becomes clearer, it enables the sunlight
to penetrate deeper too, such that the total plankton biomass over all
depth strata remains almost constant between 5m and 30m visibility where
it is limited by nutrients.
Unfortunately, the DDA method cannot distinguish between decomposable
biomass originating from various sources, such as phytoplankton, sewage,
dissolved organic matter (DOM) and zooplankton which tend to draw the data
points down and to the left of the green boomerang where they were expected.
We recently discovered an invisible thick layer of high density in clear
water where this was not expected and named it the plankton graveyard,
possibly an indicator of food chain failure when unconsumed biomass heaps
up.
The visibility measurement on the other hand, cannot distinguish between
sediment, small bubbles and phytoplankton, thereby drawing the data points
to the left of the green boomerang.
The combined effects are shown in the diagram, from original data.
We are still in the process of mapping results as these arrive, in order
to further our understanding. Also the recent technique of alcohol enhancement
will have a major influence on the data points to such extent that two
separate mapa may result.
Along the vertical axis, which is a logarithmic scale, also the actual
values for hion density have been marked in green. The colour of
the datapoints corresponds to the batches obtained from the coloured regions
shown on the inset map. The datapoints marking the plankton graveyard lie
in the grey shaded region. They have all been confirmed by sampling at
greater depths (10, 20, 40m) where hion densities are normal.
Of main concern is the orange region between the plankton limits and
the maximum densities measured. In this region the biomass of the decomposers
can increase suddenly between 11m and 9m viz. Unexpectedly decomposers
can attain densities exceeding that of the phytoplankton, suggesting that
most degradation in the sea happens between 5m and 9m viz, which agrees
with our observations! Paradoxically, a constant ingress of mud (in the
light-limited region) may limit the action of the decomposers because there
is less light to produce the phytoplankton that feeds them!
It would be interesting to know whether the graph shown above is valid
for all the world's seas. A new map is being made with biodensities derived
from alcohol-enhanced decomposition.
Decomposition deficit In the data shown above, it was thought that DDA decomposition had
expired after settling (9-13 days). However, failed tests for linearity
showed that decay continued rapidly after adding an energy food source
(fuel) like agar, jelly, sugar or alcohol. It was then realised that the
first and second laws of thermodynamics insist that the energy embedded
in organic molecules cannot be enough for decomposing them. At some stage
a small amount of additional fuel is needed to cover thermodynamic conversion
losses.
After
some experimentation, we saw that pure alcohol was the most suitable substance,
as it is also the most basic of fuels, influences pH only little and is
easy to keep and to administer. By adding two drops of 20% alcohol at an
anaerobic stage (after day 5), decomposition resumes very rapidly, resulting
in hion biodensities of two to ten times larger. Some samples (Murrays
Bay, French Bay, Seafriends aquariums) even began to stink as pH dropped
below 6.4!
The graph shown here demonstrates alcohol's drastic effect on decomposition,
as well as the ability to keep samples in one litre 'aquariums'. These
aquariums were sealed and kept in a window facing away from the sun for
over one month. The aquariums were then scraped with a clean dishcleaner
brush to resuspend all attached algae and bacteria. As one can see, the
DDA proceeds in much the same manner, with very similar rates of attack
and would have ended as the original set had 2 drops of alcohol not been
added after day five. The curve of Leigh Harbour (B, brown) shows how it
bottomed out at day five, but under alcohol enhancement continues to reveal
a biodensity of 438 instead of 78 hion!
The discovery of a thermodynamic limitation preventing complete decomposition
may have profound ecological consequences on our understanding of ecosystems.
It explains why plants provide fuels like sugars and alcohol from fruits
to the soil, such that decomposition indeed returns the desired nutrients
and minerals. In the sea it may well be the jelly component of the plankton
providing the same service, or the slime produced by plants. There may
be other providers like perhaps cyanobacteria using sunlight to provide
for the missing fuel.
The oak tree and the
aphids In our garden stands an
oak tree which rains sticky sugars down onto the decking and chairs. It
is a nuisance caused by thousands of aphids sucking its sap and wasting
sugars. I often wondered why the oak tree had no defences against these
little sapsuckers. Now I know that the rain of sugar is needed for the
soil decomposers to complete the decomposition of fallen leaves from the
previous season for the oak tree to get the nutrients and minerals it craves
for. The oak tree does not make sweet fruits, you see?
The first laws of thermodynamics 1. Energy can neither
be created nor destroyed. Thus all forms of energy ultimately convert
to heat.
2. All physical processes
lead to a decrease in the availability of the energy involved. This
defines that all energy conversions such as photosynthesis and decay are
accompanied by intrinsic losses. Some of these losses are due to the energy
being used by organisms for the sake of living. Other losses occur from
the thermodynamic conversions of one energy (a hydrogen bond, e.g.) to
another. The second law in essence prohibits a perpetuum mobilae,
a device running on no energy.
.
Freshwater explorations Lakes
and rivers seem outside the interest of the marine biologist but for us
they became very interesting as their planktonic ecosystems are simple
and stable and cannot flow away on tidal currents. Because lakes are more
tranquil, their clarity is more meaningful as a measure of phytoplankton
density. They also have a large range of parameters of which intrinsic
acidity or natural pH as we call it, is the most important.
Natural pH is measured by eliminating all forms of life, either by
complete decomposition or by other means. Each lake has its own natural
pH and when their biodensities are plotted, a straight linear relationship
is found as shown on the graph. Even the sea fits into this relationship
(Leigh 250-330; Murrays Bay 400-600 due to ingress of raw sewage).
The lake explorations gave us the insight to link all water bodies (fresh
and salt) in the world by means of a single equation. We discovered that
the maximum density and productivity of life depend on the availability
of hydrogen ions. Thus hydrogen ions are an important limiting factor
of any aquatic ecosystem, according to the maximum biodensity formula
discovered:
maximum biodensity = ALOG( 1.55 - natural
pH ) hion, where the
factor 1.55 needs further confirmation.
The
simpler freshwater ecosystems also showed that bacterial activity increases
suddenly between 100 and 200 hion biodensity, very similar to the marine
situation. Eutrophication begins here. Some eutrophied lakes have huge
biodensities (Blue Lake = 2000) and corresponding bacterial biodensities
and activity. Blue Lake's clarity (4m viz) defines its producer biodensity
at around 250 hion, leaving 1750 hion in decomposer biodensity, or 7 times
more. We discovered that the producers are able to feed this large amount
of bacteria because they are extremely productive, also following the
maximum
biodensity formula.
The
slush hypothesis or symbiotic decomposer hypothesis It is undeniable that the (un)availability of hydrogen
ions is an important (but so far overlooked) limiting factor. An 'acidic'
lake like Blue Lake (natural pH=7.19) does not only have more biodensity
than the sea according to the maximum biodensity formula (8-10 times),
but also a correspondingly larger productivity to keep up with its high
decomposition rate. The sea's pH between 8.0 and 8.3 is so high that it
limits plant growth.
It is also undeniable that full decomposition in the sea
does not take place unless an additional bacterial fuel is provided. So
the sea is apparently awash in semi-decomposed organic matter (slush,
as in semi-molten snow) waiting to be decomposed further. This could have
interesting ecological consequences. Plants for instance may well live
in a symbiotic relationship with friendly bacteria inside the slime that
they produce. As the slime feeds these bacteria, it also enables them to
fully decompose the slush, providing not only the craved-for nutrients
and minerals, but also for scarce hydrogen ions. The slime on plants should
thus be relatively acidic (pH 7 instead of 8), which needs to be tested.
One could think of seaweeds living inside a thin cocoon of slime and bacteria
that offer a more productive environment. In the scarce environment of
salt water, this could well be nature's solution to higher plant productivity.
However, it is also a risky way of life, reason perhaps why seaweeds are
so sensitive to degradation, a paradox because degradation is accompanied
by higher free nutrient levels.
This idea carries further to the powerplankton,
which could well consist of larger phytoplankters (like diatoms) living
in a symbiotic relationship with friendly bacteria and benefiting from
them in a similar way. It makes these phytoplankters much more productive,
while it also provides for the bacteria to rapidly decompose the host once
it dies. The reason we are not measuring either productivity or decay is
that this happens in a short cycle on the skin of the phytoplankter. As
slush
is decomposed, its products (hydrogen ions + carbondioxide + nutrients)
are immediately converted into plant matter with no measurable change in
pH in the water outside. This also suppresses surrounding bacterial activity
as the phytoplankters act like a bacterial substrate. As the producers'
productivity increases, the planktonic (free-floating) decomposers' activity
decreases, which makes the plankton nutritious and safe to live in. The
producers' increased productivity is evident from a 0.10 higher initial
pH.
The
slush
hypothesis also insists that corals which are known as mixotrophs
(mixed-feeders) for the plant cells in their tissues, cannot work without
symbiotic decomposers (bacteria) on their skins. The DDA method found high
concentrations of a mysterious substance in the sea (slush), particularly
in the blue desert seas with very little nutrients and chlorophyll. Mixotrophs
like corals are designed to harvest this slush which has up to 8 times
more biomass than the phytoplankton. This is possible only with symbiotic
decomposers on their skins. It may also explain why these creatures are
sensitive to changes in their environment like eutrophication and higher
temperatures. Thus corals are animal + plants + bacteria. The slush
hypothesis predicts that many animals like these remain to be discovered,
even in the zooplankton.
The photograph shows a close-up of the coral polyps of
a tropical coral. Their brown colour is caused by brown symbiotic algae
in their tissues. The polyps have lost their tentacles for catching zooplankton
because their main food now comes direct from sunlight. Protected by their
limestone skeletons, these polyps dare to expose themselves by day at risk
of being scraped by fish like parrotfish.
One may wonder where most of the slush comes from.
The second law of thermodynamics insists that the bottom decomposers deeper
than the photic zone will not be able to fully decompose wastes and dead
bodies. Thus the deep sea decomposers must continuously provide slush
that eventually finds its way to the surface. How this happens and how
old most of the slush is, remains a mystery.
"Worldwide, mixotrophy is very widespread in the top
layer of oceanic water (up to 90% of organisms can be mixotrophic) and
in the layer beneath mixotrophs would account for the greatest part of
the organisms present there. It is a phenomena that has been very important
in evolution and is very important for the continuing of life in the oceans,
with their rapidly changing environmental conditions and highly variable
food and anorganic nutrients concentrations and light intensities. Symbiosis
between a heterotrophic multicellular organism and phototrophic unicellulars
can also be seen as a form of mixotrophy. When these forms are also taken
into account, mixotrophy may well be the most abundant strategy in oceanic
lifeforms."
Ecophysiology of mixotrophs, Erwin Schoonhoven,
January 19, 2000
Conclusions The importance of first the discovery of the planktonic decomposers
as the missing ecofactor, then the formulation of the Plankton Balance
hypothesis and finally a method to measure the health of the sea, cannot
be overstated. It required someone to think outside the square, someone
who is not part of the scientific community, as it is not being taught
at universities, does not appear in any text book or scientific publication
and has simply been overlooked completely. The DDA and the thinking leading
up to it has given mankind new eyes through which he can see new things,
and old things in a new light.
The Dark Decay Assay is now the first test to consider for anyone working
with aquatic ecosystems. It is cheap and easy but unfortunately takes 1-2
weeks of incubation, preferably at a standard temperature. This brings
the laboratory into the hands of conscientious amateurs who are willing
to do something to save our seas. Einstein observed that the
problems of today cannot be solved with the consciousness that created
them. I hope that the DDA will bring the new consciousness that enables
us to turn the tide in the predicament of the seas, lakes and waterways,
as it also empowers many to take part. For me this is a very exciting aspect.
The problems that exist in the world today
cannot be solved by the level of thinking that created them. - Albert Einstein
The advantages of the DDA are:
measures the essential: even though concentrations of ammonia, nitrites
and nitrates are low or acceptable, the water can still be unhealthy, which
shows up in a DDA test. The DDA measures the most essential qualities of
natural water in units that relate to life.
small sampling volume: the DDA needs only 30ml sample volume; no
sieving, trawling, pumping, spinning (centrifuge) required.
rapid acquisition: all one needs to do is to take a scoop of water
and divide it over several vials. The water can be kept alive in a cool,
light place to be measured one or more days later, without essential loss
of information.
accuracy and range: the DDA has shown to produce accurate, repeatable
and linear results over a range of four orders of magnitude (10 to 10,000).
simplicity: the DDA can be done by school children as young as 14
years of age.
low cost: for less than $500 one can have a portable DDA laboratory.
portable: a small incubator operating on 12 Volt batteries can be
operated from a car, a boat or by connection to a mains supply. All devices
are battery-operated and portable (pH meter, salinity meter, thermometer,
GPS).
empowers amateurs: the DDA brings an important tool in the hands
of conscientious amateurs, enabling them to monitor true water quality
in their neighbourhoods. A network of these could be organised to generate
the data for a national database of water health.
The DDA brings a new way of thinking:
redefines eutrophication: there exists no general agreement on what
eutrophication is and when it begins. The DDA has shown that plankton can
become sick when water quality is still considered good by other criteria
such as visibility, oxygen content and nutrient loads. The DDA may define
testable values for eutrophication. It may well be that eutrophication
begins when the powerplankton disappears.
changes the way we think: the discovery of the missing aquatic ecofactor
and the DDA to measure it, will change the way we think about aquatic ecosystems
and the health of these. The threat from planktonic decomposers is real
and decisive and must change our thinking.
gives solid support for the Plankton Balance hypothesis:
the planktonic decomposers play a decisive role in the health of the environment;
they can suddenly increase and become aggressive; when eutrophied, their
biomass can exceed that of the producers many times; they constitute a
formidable ecological factor which directly or indirectly affects every
creature in the sea. The DDA gives solid support for this idea.
makes new discoveries: as is to be expected from new analysis methods,
the DDA will lead to many new discoveries.
questions previous scientific work: previous scientific work did
not take account of the planktonic decomposers and may become irrelevant
in the light of these new discoveries. The discoveries made with the DDA
may indeed affect our thinking about lake and ocean 'acidification' and
global warming.
must be included in null hypotheses: because the plankton decomposers
have such a large influence, they must become part of the null hypotheses
of all aquatic science. One must be able to prove that they had no effect
on the results or conclusions obtained from these. This is a serious wake-up
call for marine and freshwater scientists as it may also disqualify their
previous work.
marine reserves don't help: the influence of the eutrophied planktonic
decomposers is now such a large part of aquatic degradation that marine
reserves do not, cannot and will not work to save the sea or lakes.
declining fisheries: the decline in the world's fisheries may not
be entirely or mostly due to overfishing but to plankton degradation. It
is naive to expect healthy fisheries in sick seas.
chlorophyll as plankton productivity: the measurement and assessment
of plankton productivity by chlorophyll or nutrient concentrations may
not be relevant at all.
The importance of something new can
be measured by how much it destroys of what is old. - Floor Anthoni, 2005
Discoveries Whenever a new measuring technique is invented, new discoveries are
bound to follow. This chapter summarises them.
about marine plankton
biodensity: total biodensity can exceed phytoplankton biodensity
three to one. Decomposers can form a large part of the whole.
incomplete decomposition: in sea water the molecules of life cannot
be decomposed fully without an additional source of fuel for bacteria.
This may have far-reaching ecological consequences also for our understanding
of terrestrial ecosystems.
rates of attack: where a high biodensity is measured, the bacterial
rate of attack is also high, but it depends on the type of plankton assemblage.
Bacterial activity increases rapidly as biodensity increases, and after
that proportionally.
degradation: the measured rates of attack correspond to observed
degrees of degradation. Classification of plankton as healthy, or sick,
is possible from the rates of attack measured with the DDA.
powerplankton: a plankton assemblage has been found exhibiting very
low chronic decay and very high rates of decomposition once its phytoplankton
dies. It is apparently able to transfer solar enegy effectively into the
food chain while being safe to live in.
status of the sea: the coastal seas we measured were in a much worse
state than anticipated. In fact, very little healthy plankton was found,
even in southern autumn, known for its clear waters.
sewage: The influence of sewage, raw or treated is much more than
we thought. It seriously affects large areas.
plankton graveyard: in remote deep water where vertical mixing is
negligible, we found a thick layer of high biodensity, as if the food chain
was broken and food accumulated.
natural pH: the natural pH of the sea is around 8.03 - 8.11, but
in estuaries slightly lower. Measuring the pH without first disabling all
life within a sample, appears maningless.
new gradients: two new gradients were discovered: the plankton
balance gradient where the decomposer activity and biodensity change
as well as their ratio, and the slush gradient of incompletely decomposed
organic molecules. These gradients profoundly affect sea life.
about freshwater plankton
incomplete decomposition: like sea water, natural fresh water does
not decompose completely without the addition of a high energy food source
for bacteria.
natural pH: the natural pH of a freshwater lake is its most important
quality and determines maximum density and productivity.
density: freshwater plankton demonstrates a large range of biodensities
and bioproduction, much larger (up to 8 times) than the sea. Relatively
acidic lakes can accommodate biodensities of around 2000 hion (Blue Lake,
natural
pH=7.19).
decomposers: the biomass of the decomposers can exceed that of the
producers ten to one but freshwater life is not as sensitive to these as
marine life.
rates of attack: freshwater ecosystems exhibit low decomposer activity
at biodensities comparable to those found in a healthy sea (less than 200
hion). Between 100 and 300 hion biodensity, the decomposer activity increases
rapidly, followed by a proportional increase, similar to that found for
the sea.
water clarity: ironically, the decomposers help to clear the water
as chlorophyll decomposes readily.
about decomposition
measuring precision: the DDA method of using decomposition to measure
decomposer activity and biodensity has worked well with high precision,
repeatability and linearity within four orders of magnitude. For the first
time the nano-, pico- and femto- plankton are measured as part of the whole,
opening a new window on plankton ecosystems.
alcohol enhancement: in many samples, decomposition does not complete
and a small quantity of a high quality fuel must be added, like ethyl alcohol.
water clarity: it appears that visible chlorophyll is destroyed
in an early stage of decomposition, thereyby clearing the water even though
a high component of bacteria and slush or dissolved organic matter
may remain.
new ecological laws (hypotheses)
thermodynamic conversion deficit: the energy embedded in biomolecules
is not enough to decompose them completely. Another form of high-energy
food must be provided to bridge the deficit and to finalise decomposition.
This applies to all ecosystems, terrestrial and aquatic.
hydrogen ions as overlooked limiting factor: the availability of
hydrogen ions limits aquatic life. The more hydrogen ions (acidity) the
more biodensity and productivity (but there are bound to be limits).
maximum density of life: the maximum density of life in aquatic
ecosystems is proportional to the availability of hydrogen ions according
to the maximum biodensity formula.
productivity: the maximum productivity of phytoplankton is also
proportional to the availability of hydrogen ions.
natural pH: the natural pH of a body of water is the pH it assumes
in the absence of all life. It determines the availability of hydrogen
ions and thereby its maximum biodensity and bioproductivity. It is the
most important measurable property of lakes.
slush hypothesis or symbiotic decomposer hypothesis: slush
(incompletely decomposed biomatter) may be nature's way of increasing plant
productivity, particularly in the sea where a high pH (few H+ ions) and
salt (makes water less solvent) create an environment of scarcity. Plants
live in symbiosis with 'friendly' decomposers which are fed high energy
fuel in order to decompose slush. In return, plants receive hydrogen
ions, carbondioxide and nutrients. Thus successful plants (and phytoplankton)
live inside a thin cocoon of slime and bacteria. The slush hypothesis
also explains how powerplankton works and mixotrophs like
corals. It follows that the deep sea soil where light is insufficient,
produces much slush. Slush is a large component of biodensity
in clear oceans.
powerplankton: a plankton assemblage has been found exhibiting very
low chronic decay and very high rates of decomposition once its phytoplankton
dies. It is apparently able to transfer solar enegy effectively into the
food chain. It is postulated that this kind of plankton assemblage was
once common as it powered once bountiful fisheries. As it is disappearing
everywhere in the world, fisheries have become sensitive to overfishing
while recovering only slowly or not at all.
dimethyl sulphide: dimethyl sulphide (DMS) is a decomposer gas.
As the biomass of decomposers is increasing worldwide due to the compound
effects of eutrophication, DMS is bound to be increasing rapidly, as also
its effect on weather and climate.
invisible biomass: decomposers and slush remain invisible
even though their combined biomass may exceed that of the visible phytoplankton
many times, and also many times that of all other life on Earth.
Science requires only one investigator
... with results that are verifiable by reference to the real world.
- Michael Crichton, 2003
The way science really works is that new
methods of acquiring information are created, and data is collected. The resulting data is always surprising
and never entirely predicted. This type of science has been almost totally
destroyed by the corruptions which have overtaken science. - Gary Novak, Independent Scientist
International Census
of Marine Microbes (ICoMM) (April 2010)
The International Census
of Marine Microbes (ICoMM) found an astonishing number of new microbe species
in the sea, estimating their variety at close to one billion species, 20,000
of which have so far been catalogued. "The marine microbes in fact constitute
somewhere between 50 to 90 percent of all ocean biomass, and by volume
weigh the equivalent of 240 billion African elephants."
The average weight of an
African Elephant is 4.5 ton, which makes the estimated marine microbial
biomass 1080 Gt - many times the combined weight of all other species together.
Applications The DDA in its generality has many applications where bacterial activity
and biomatter are involved, particularly in aquatic ecosystems. Here is
a list of useful applications.
marine plankton: measuring the health of the water in the sea, estuaries
and marinas.
freshwater plankton: measuring the health of lakes and rivers.
aquariums: measuring and monitoring the health of aquarium water,
both fresh and salt.
fish ponds: monitoring the biological loading of enclosed ponds.
aquaculture: monitoring water quality to understand problems.
mariculture: monitoring water quality in marine aquaculture open
waters.
marine laboratory saltwater systems: being aware of water quality
and how to handle it for optimal health.
tracking polluters: the origins of eutrophying pollution can be
tracked and quantified.
monitoring development: the consequences of new developments on
the sea and on lakes can be monitored
monitoring progradation: as measures are taken to lessen eutrophication,
results can be monitored.
ecosystem research: research into the functioning of ecosystem components.
First of all one must know the health of the ecosystem one is working with.
Terminology As happens when a new field of scientific investigation is opened,
new words are invented to describe new items and processes. Here is an
alphabetical list of new and old terms used, and their meanings.
aerobic: (Gk: aer= air; bios= life; life growing in air) aerobe=
an organism growing in the presence of air or needing air for growth. aerobic=
growing in contact with air and thus a supply of oxygen and escape of carbondioxide.
alcohol enhancement: often the DDA does not complete due to
energy conversion losses, such that a small quantity of additional energy
is needed to complete the decay. Alcohol was preferred over other energy
foods like sugar and agar because it is the most basic of energy foods
that only bacteria can make use of, almost immediately. It is also easily
obtained, calibrated and kept and it does not affect the measurement. Not
all samples need it but on some it makes a 300% difference! One drop of
alcohol at 20% is added for every 10ml of sample liquid on day 3-5 of incubation,
when decomposition slows down.
anabolic: (Gk: ana= up; ballo= throw; upbuilding) the synthesis
of complex molecules from simple ones, together with the storage of energy.
Photosynthesis is an anabolic activity.
anaerobic: (see aerobic) growing in the absence of or contact
with air, resulting in a lack of oxygen. Animals and plants cannot live
anaerobically but some bacteria can. Anaerobic decomposition produces different
intermediate molecules like hydrogen sulphide which gives a putrid smell.
assay: (Fr: essay= try, test) the determination of the content
or strength of a sample.
assemblage: (L: ad= to; simul= together; Fr: assembler= get
together) a collection of species within an ecosystem. The assemblages
of species and their numbers can change rapidly within plankton ecosystems
but together they form a functional whole.
autotroph: (Gk: auto- self; trephos= feed, nourish; self-feeding)
a plant; an organism feeding from sunlight.
biomass: (bio + mass) the total weight of organisms in a given
area or volume, often expressed in kg dry matter. Note that the DDA cannot
distinguish between living and dead organic matter and we use the words
biomass and biodensity to include both.
biodensity: (bio + density) a new word to describe the biomass
per litre as is necessary for planktonic ecosystems. It is expressed as
dry matter per litre of liquid, or as the weight of carbon per litre.
buffer: (a thing that cushions) Chemical: a substance that maintains
the hydrogen ion concentration of a solution when an acid or alkali is
added or when polluted somewhat.
calomel: (Gk: calo= beautiful; melas= black) a mercury compound,
medically used as cathartic (purgative). Mercurous chloride HgCl2.
calomel electrode: a conductor made with mercurous chloride,
through which electricity enters or leaves a liquid or gas.
catabolic: (Gk: cata= down; ballo= throw; breaking down) the
breaking down of complex molecules into simpler ones with release of energy.
Decomposition and decay are catabolic activities.
chronic: (Gk: chronos= time) persisting for a long time or continuously.
chronic decay: the decomposition (decay) found even when organisms
like phytoplankton are still alive. The decomposition of organisms that
died earlier on. Chronic decay indicates a continuous dying of organisms,
a sign of ill health.
DDA: Dark Decay Assay, a new term coined for the measuring technique
that places a sample of natural water containing life forms, in a dark
sealed container to achieve that plants die from lack of light while decomposers
decompose these. The resulting increase in hydrogen ions, measured with
a pH meter, is a proxy for the biomass (biodensity) decomposed and the
activity of the decomposers. The term dark decay is also used for
the loss of electronic charge in charge-coupled devices (CCDs) used for
photographic imaging.
decay: (L: de-= down, completely; cadere=fall; to fall down)
to rot, decompose.
decomposers: (L: de-=down, completely; com-= with, altogether;
ponere= to put; to decay or rot) decomposers are an important guild of
lifeforms that are able to break down the complex molecules of life, including
woody substances. They consist mainly of animals with appendages to physically
tear matter, fungi and single-celled bacteria, and viruses. Planktonic
decomposers must from necessity be very small, consisting mainly of single-celled
fungi, bacteria and viruses.
degrade: (L: de-= down; gradus= step; step down) to reduce to
a simpler molecular structure, converting energy to a less convertible
form. To reduce to a lower rank or degree. This word is now extensively
used to describe the deterioration in the environment.
density: the degree of compactness of a substance. The density
of seawater means its specific weight which increases due to saltiness.
The biodensity of seawater is used to describe its density in biomass.
Density is expressed as kg per litre. The density of water is 1.0.
DOM: dissolved organic matter, a catch-all term for unknown
organic substances in the water. See also slush.
ecofactor: (Gk: oikos= house, environment; environmental factor)
ecological factor or environmental factor or limiting factor or life-determining
factor. The limiting factors on land are all well known. Of these moisture
and temperature are the most decisive since life depends so much on these.
But in the sea these two are of less consequence. The planktonic decomposers
have completely been overlooked as an important ecofactor. The availability
of hydrogen ions has also been overlooked as an important ecofactor.
ecosystem: a biological community of interacting organisms and
their physical environment. An ecosystem is not a complete ecosystem if
nutrients are not used by plants and regenerated by decomposers. The cycles
of energy and nutrients are closed.
eutrophication: (Gk: eu-= well; trephos= feed, nourish; overfed,
overnourished) an aquatic environment rich in nutrients and therefore upsetting
the natural balance. It may result in obscuring light from deeper plants,
excessive rot which uses up all oxygen, and aggressive decomposers that
attack all life forms.
expired: (L: ex= out of; spirare= to breathe) to come to an
end. This word is used to describe natural water which through full decomposition
in darkness has lost all decomposable biomass and is then allowed to equilibrate
(ventilate) with the atmosphere. It is natural water that has lost all
its solar energy. The resulting pH is called natural pH.
femtoplankton: (Danish: femten, femto= 15) 0.02-0.2 µm
(viruses)
fuel: (L: focus= hearth; Old French: fouaille) a material used
as a source of heat or power. It describes food high in energy like carbohydrates
but low in proteins, like sugars and fats. Alcohol can be used as fuel
for yeasts which convert it to vinegar in the presence of oxygen, but only
bacteria are able to use alcohol as fuel in the absence of oxygen.
glass electrode: the glass bulb electrode used for measuring
the pH of liquids.
graveyard: (plankton graveyard) a descriptive word for the dense
plankton biomatter aggregating near the surface in layers up to 5 metre
deep. See also slush.
healthy plankton: a name used to describe a plankton assemblage
high in food value but low in bacterial threat to health. It is used qualitatively
but may later be defined quantitively.
hion: a new unit, introduced here as a proxy for biodensity.
One hion is the amount of biomass per litre decomposed in darkness, measured
in pH units. It is calculated from the initial and final pH values as:
antilog( - final pH) - antilog( - initial pH) in parts per billion (1E-9).
The number of hydrogen ions at a pH of 9.00 corresponds to one hion. The
hion unit allows for comparison without knowing the actual densities as
dry organic matter per litre.
hydrogen ion: a free hydrogen atom with the charge of one unit.
H+
hydronium ion: the same as a hydrogen ion, but describing it
better as still bound to a water molecule: H2O.H+ or H3O+
hydroxyl ion: the OH- ion, counterpart of the hydrogen ion.
Bound together, they form water HOH. Some of the water is dissociated into
(relatively) free ions H+.OH-
incubator: a box or bath that keeps a constant temperature for
hatching eggs or nursing premature babies, or for growing micro-organisms.
Since the DDA technique relies on the activity of micro-organisms, it is
sensitive to temperature. The incubator used with the DDA enables one to
compare results wherever and whenever.
killerplankton: a plankton assemblage very high in chronic decay,
showing a steep drop in its DDA curve and high biodensity. This kind of
assemblage transfers the solar energy into the bacteria rather than the
food chain. Its high bacterial activity threatens all aquatic life forms.
latent: (L: latent= hidden) concealed, dormant. Existing but
not well developed. Ever-present but not developed.
lysis: (Gk: lysis= loosening) the disintegration of a cell.
mesoplankton: (Gk: mesos= middle) 0.2-20 mm (copepods)
microplankton: (Gk: micros= small) 20-200 µm (diatoms,
dinoflagellates)
mixotroph: (L:miscere= to mix; mixtus= mixed; Gk:trephos= to
feed, nourish) an organism that feeds in mixed ways, referring to animals
with plant cells in their tissues like corals and some anemones. The new
slush
hypothesis insists that these organisms can exist only if they have
symbiotic bacteria as well. Thus corals are animal + plant + bacteria.
Mixotroph species are also bound to be discovered in the zooplankton. The
unicellular mixotrophic microbes are capable of feeding from both sunlight
(phototroph) and something else (phagotroph), and these are found amongst
many single-celled aquatic organisms (flagellates [dinoflagellates, prymnesiophytes,
chrysophytes, cryptophytes], ciliates, sarcodines, and radiolarians)
as well as in sponges, corals, rotifers, and even in higher plants
mol, mole, molar: (from molecule) the SI unit of amount of substance
equal to the quantity containing as many elementary units as there are
atoms in 12 gram of carbon-12. Thus one mole of water contains two hydrogen
atoms of weight 1 and one oxygen atom of weight 16, totalling 18 gram.
nanoplankton: (Gk: nanos= dwarf) planktonic microbial organisms
between 2 and 20 µm in size. (diatoms, dinoflagellates, coccolithophorids)
natural pH: the intrinsic pH of natural water without any influences
from biotic (life) factors. It is water that through full decomposition
in darkness followed by full exposure to the atmoshpere, has lost all its
solar energy and thereby all possible influences that could have altered
its pH.
pH: potential of hydrogen, meaning the electrical potential
caused by hydrogen ions. It is about 60mV per pH unit. A logarithm of the
reciprocal of the hydrogen ion concentration in moles per litre of a solution,
giving a measure of its acidity or alkalinity.
phagotroph: (Gk: phagos= eat; trephos= nourish) an organism
that eats something to nourish itself: grazers, predators, scavengers and
detritus-feeders but is mainly used for small planktonic microbes.
photic: (Gk: phos, photos= light) relating to light. In aquatic
systems the photic zone refers to the depth to which light still
causes photosynthesis. Light is easily diminished by dense plankton and
mud.
photoheterotroph: same as mixotroph.
photosynthesis: the process by which the energy of sunlight
is used to synthesise carbohydrates and other molecules of life from carbon
dioxide and water and other elements.
photototroph: (Gk: photos= light; trephos= feed, nourish; light-feeding)
a plant; an organism feeding from sunlight.
phyto-: (Gk: phyton= plant) relating to plants. Phytoplankton
is the assemblage of plant plankton.
picoplankton: (Spanish: pico= a little bit) planktonic organisms
in the range of 0.2-2 µm, mostly bacteria. (cyanobacteria, other
bacteria, Prochlorococcus, and Synechococcus). The open oceans contain
mostly picoplankton to 200m depth. Marine pelagic bacteria are small: 0.03-0.4
µm.
phagotroph: (Gk: phagos=food; trephos= feed, nourish; a something
eater) to distinguish plants (autotrophs or phototrophs) from all others
(phagotrophs) like grazers and predators. But bacteria living from Dissolved
Organic Carbon (DOC or slush) are called saprotrophs. Phagotrophs
have no photosynthesising pigments.
plankter: a single plankton organism. Hence zooplankter
and phytoplankter.
plankton: (Gk: planktos= wandering; plazomai= to wander) organisms
spending some part of their life cycle suspended in the water. It includes
jellyfish, larvae of non-planktonic adults, microscopic animals living
entirely planktonic, single-celled plants of a large range of sizes and
single-celled decomposers including bacteria and viruses. Plankton is conveniently
divided into groups depending on size: Megaplankton 20-200
cm,
Macroplankton 2-20 cm, Mesoplankton 0.2 -20 mm,
Microplankton
20-200 µm,
Nanoplankton 2-20 µm,
Picoplankton
0.2-2 µm (mostly bacteria), Femtoplankton smaller than 0.2
µm (marine viruses). Note in this respect that the wavelength of
blue-green light is 0.5µm.
plankton balance: a new term coined by us drawing attention
to the dual nature of plankton: on the one hand it feeds with the plant
matter it synthesises, whereas on the other hand it kills by means of its
decomposers. The plankton balance within the plankton can change rapidly
from being nutritious and healthy (power plankton, healthy plankton) to
being a threat to all life, without providing digestible food (sick plankton,
killer plankton).
powerplankton: a plankton assemblage very low in chronic decay,
showing a flat shoulder in its DDA curve, lasting for over 24 hours, followed
by very rapid decay. It is postulated that this kind of assemblage provides
the most food value for the least threat by committing suicide (lysis).
The loss of this kind of plankton could have serious consequences for fisheries.
producer: a photosynthesiser or plant.
prograde: the opposite of degrade, a new word denoting improvement
in the environment.
proxy: (from old English procuracy= the taking care of; L: procurare=
to take care of, to buy for someone else) a person authorised to act as
a substitute. In the case of the DDA method, the measured change in hydrogen
ions is a substitute for density of biomass in the sample. The proposed
unit for this is the hion.
RDOC: Recalcitrant or Refractory (stubborn) Dissolved Organic
Carbon, the name used in some scientific articles for a fraction of DOC
that is resistant to bacterial decomposition. It is identical to our term
slush.
RoA: Rate of Attack. The rate at which decomposers decompose
biomass, particularly at the very beginning of the DDA test, when phytoplankton
in the sample is not deemed to have died yet. The Rate of Attack measures
decomposed biomass in hions after a set time, like 48 hours. For convenience
we use RoA48 and RoA24.
saprotroph: (Gk:sapros= rot; trephos= feed, nourish) a decomposer
living from rot but more specifically, an organism living from DOC (Dissolved
Organic Carbon) like slush. These are obviously bacteria.
scavenge: (from Flemish: scauwen, schouwen= to show) to search
for and collect discarded items (from a beach or dump). It is used to describe
the process of obtaining 'free' but infrequent items, like carbon dioxide
from air (one in 3000 molecules) and hydrogen or other ions from water.
Secchi: Fr. Pietro Angelo Secchi, an Italian astrophysicist,
was requested to measure transparency in the Mediterranean Sea by Commander
Cialdi, head of the Papal Navy. Secchi was the scientific advisor to the
Pope. Secchi used some white discs to measure the clarity of water in the
Mediterranean in April of l865. Various sizes of discs have been used since
that time, but the most frequently used disc is an 8 inch (20cm) diameter
metal disc painted in alternate black and white quadrants.
The Secchi disc is used to measure how deep one can see into
the water. It is lowered into the water by unwinding the waterproof tape
to which it is attached and until the observer loses sight of it. The disc
is then raised until it reappears. The depth of the water where the disc
vanishes and reappears is the Secchi disc reading. The depth level reading
on the tape at the surface level is recorded.
sick plankton: a new name for a type of plankton assemblage
with high bacterial activity (and threat to life) but low food value. At
present used qualitatively.
slush: (comes originally from sludge; watery mud or thawing
snow, indicating its half-accomplished state) a new word to describe the
incompletely decomposed biomass in the sea which waits for an additional
bacterial fuel to complete the decomposition process that finally releases
nutrients. The term Dissolved Organic Matter (DOM) covers all forms of
biomatter, including slush.
symbiont: (Gk: syn-= with/together; bios= life; symbio= living
together) two organisms of different type living together for mutual benefit.
thermodynamics: (Gk: therme= heat; thermos= hot; dynamis= power)
the science of the relationships between heat and other forms of energy.
dynamics=
any branch of science in which forces or changes are considered.
vial: (Gk: phiale= a broad, flat vessel) a small glass container,
especially for holding liquid medicines. A test tube.
visibility: the range of vision as possible with given conditions
of light and atmosphere. In this chapter, visibility means the distance
one can see objects under water. It is measured by looking at a white object
to see its shape disappear. See also Secchi above.
viz: divers' short word for visibility.
Bibliography Books and articles relevant to the Dark Decay Assay.
[let me know]
nzmss.rsnz.org/pubdocs/pdfdocs/Review_45_2003.pdf
Presentation of The Plankton Balance Hypothesis to the New Zealand
Marine Sciences Conference 2003 in Auckland. (p29 of 171pp, June 2004)
nzmss.rsnz.org/pubdocs/pdfdocs/NZMSS47.pdf
Presentation of The Dark Decay Assay (DDA), a new technique for measuring
the health of plankton to the NZMSS conference 2005 in Wellington.
(p23 of 271pp, Aug 2006)
Changes and additions Check this chapter for the latest changes and additions. This research
has been curtailed due to lack of funds.
yyyymmdd - description
20080703 - new
page added about scientific publications that support or refute our
discoveries.
20060712 - DMS and
cloudformation diagram added to dda for dummies.
20051008 - DDA for
dummies added (10p) and corrections made to various chapters.
20050830 - Changes
made to the wordings in various chapters
20050826 - Presented
to the NZ Marine Sciences conference 'human impacts on the marine environment'
in Wellington.
20050803 - Published
on the Web
20050510 - A beginning made writing the
DDA chapters.
20050109 - Discovery of the Dark Decay
Assay method
20030902 - The Plankton Balance
hypothesis presented to the NZ Marine Sciences Conference in Auckland,
NZ.
20030617 - Discovery of the missing ecological
factor in aquatic ecosystems, the planktonic decomposers.
 It
didn't take long to discover that this had to be the planktonic decomposers
consisting of bacteria, fungi and viruses. These living organisms are so
small that they occupy the pico- and femto-plankton,
invisible to the optical microscope. What people had overlooked is that
the food chain is not all the service that plankton delivers, but
it also contains potent decomposers that recirculate the nutrients from
wastes and dead bodies. Their task is to break dead biomatter apart, thereby
consuming the last of its solar energy, as nutrients contain no such energy.
Enthusiastically these decomposers will also attack living organisms such
that living in the sea depends on a precarious balance - the Plankton
Balance that feeds but also kills. Even those organisms not depending
on plankton for food, still need to breathe it, and even marine mammals
who do not breathe it, are bound to be affected.
It
didn't take long to discover that this had to be the planktonic decomposers
consisting of bacteria, fungi and viruses. These living organisms are so
small that they occupy the pico- and femto-plankton,
invisible to the optical microscope. What people had overlooked is that
the food chain is not all the service that plankton delivers, but
it also contains potent decomposers that recirculate the nutrients from
wastes and dead bodies. Their task is to break dead biomatter apart, thereby
consuming the last of its solar energy, as nutrients contain no such energy.
Enthusiastically these decomposers will also attack living organisms such
that living in the sea depends on a precarious balance - the Plankton
Balance that feeds but also kills. Even those organisms not depending
on plankton for food, still need to breathe it, and even marine mammals
who do not breathe it, are bound to be affected. Measuring
the decomposers
Measuring
the decomposers
 Here
is an example of a 250km round-trip in the outer Hauraki Gulf, New Zealand.
The distance between points I and M is about 40 nautical miles (75 km).
M is located at the territorial boundary which also marks the edge of the
continental shelf. The graph shows measured pH vertically and days incubation
at the standard temperature of 27ºC. The red rectangle is a movable
window of 48 hours to measure the 48 hour Rate of Attack from the drawn
curves. Note that decomposed biomass (H+ion proxy or hions) increases
downward with decreasing pH. Note how the initial pH always climbs towards
the end of the day, due to producer activity opposing that of the decomposers.
Note that the total decomposed biomass at day 13 shows only small differences
between sites. Highest density (lowest final pH) is D inside a small harbour
whereas lowest density (highest final pH) is M. Although M has a noticeably
smaller biomass, it also has the lowest Rate of Attack (5) in 48
hours. Conversely, D has the highest RoA (15). These measurements
were taken at the end of summer (16 April) when the waters clear up as
their nutrients have been consumed and blue water mixes with the coastal
water. Even so, it was an unusually murky year with water clarity ranging
from 4m (D) to 29m (P). All sites suffered from chronic decay. These
results have also been mapped in the coastal map below.
Here
is an example of a 250km round-trip in the outer Hauraki Gulf, New Zealand.
The distance between points I and M is about 40 nautical miles (75 km).
M is located at the territorial boundary which also marks the edge of the
continental shelf. The graph shows measured pH vertically and days incubation
at the standard temperature of 27ºC. The red rectangle is a movable
window of 48 hours to measure the 48 hour Rate of Attack from the drawn
curves. Note that decomposed biomass (H+ion proxy or hions) increases
downward with decreasing pH. Note how the initial pH always climbs towards
the end of the day, due to producer activity opposing that of the decomposers.
Note that the total decomposed biomass at day 13 shows only small differences
between sites. Highest density (lowest final pH) is D inside a small harbour
whereas lowest density (highest final pH) is M. Although M has a noticeably
smaller biomass, it also has the lowest Rate of Attack (5) in 48
hours. Conversely, D has the highest RoA (15). These measurements
were taken at the end of summer (16 April) when the waters clear up as
their nutrients have been consumed and blue water mixes with the coastal
water. Even so, it was an unusually murky year with water clarity ranging
from 4m (D) to 29m (P). All sites suffered from chronic decay. These
results have also been mapped in the coastal map below.
 In
order to better understand the data in the above map, memorise the diagram
shown here, plotting phytoplankton density (green) and decomposer density
(orange) on a linear scale (but logarithmic visibility scale). It shows
how the phytoplankton reaches a maximum between 4-5m viz. It also
shows how the decomposers can increase suddenly between 11-9m viz.
The resulting rate of attack (RoA), however, is more erratic but follows
an average according to the red curve.
In
order to better understand the data in the above map, memorise the diagram
shown here, plotting phytoplankton density (green) and decomposer density
(orange) on a linear scale (but logarithmic visibility scale). It shows
how the phytoplankton reaches a maximum between 4-5m viz. It also
shows how the decomposers can increase suddenly between 11-9m viz.
The resulting rate of attack (RoA), however, is more erratic but follows
an average according to the red curve.
 After
some experimentation, we saw that pure alcohol was the most suitable substance,
as it is also the most basic of fuels, influences pH only little and is
easy to keep and to administer. By adding two drops of 20% alcohol at an
anaerobic stage (after day 5), decomposition resumes very rapidly, resulting
in hion biodensities of two to ten times larger. Some samples (Murrays
Bay, French Bay, Seafriends aquariums) even began to stink as pH dropped
below 6.4!
After
some experimentation, we saw that pure alcohol was the most suitable substance,
as it is also the most basic of fuels, influences pH only little and is
easy to keep and to administer. By adding two drops of 20% alcohol at an
anaerobic stage (after day 5), decomposition resumes very rapidly, resulting
in hion biodensities of two to ten times larger. Some samples (Murrays
Bay, French Bay, Seafriends aquariums) even began to stink as pH dropped
below 6.4!
 The
slush hypothesis or symbiotic decomposer hypothesis
The
slush hypothesis or symbiotic decomposer hypothesis
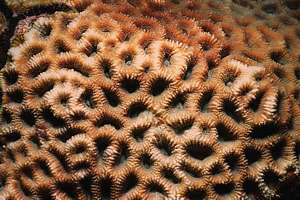 The
slush
hypothesis also insists that corals which are known as mixotrophs
(mixed-feeders) for the plant cells in their tissues, cannot work without
symbiotic decomposers (bacteria) on their skins. The DDA method found high
concentrations of a mysterious substance in the sea (slush), particularly
in the blue desert seas with very little nutrients and chlorophyll. Mixotrophs
like corals are designed to harvest this slush which has up to 8 times
more biomass than the phytoplankton. This is possible only with symbiotic
decomposers on their skins. It may also explain why these creatures are
sensitive to changes in their environment like eutrophication and higher
temperatures. Thus corals are animal + plants + bacteria. The slush
hypothesis predicts that many animals like these remain to be discovered,
even in the zooplankton.
The
slush
hypothesis also insists that corals which are known as mixotrophs
(mixed-feeders) for the plant cells in their tissues, cannot work without
symbiotic decomposers (bacteria) on their skins. The DDA method found high
concentrations of a mysterious substance in the sea (slush), particularly
in the blue desert seas with very little nutrients and chlorophyll. Mixotrophs
like corals are designed to harvest this slush which has up to 8 times
more biomass than the phytoplankton. This is possible only with symbiotic
decomposers on their skins. It may also explain why these creatures are
sensitive to changes in their environment like eutrophication and higher
temperatures. Thus corals are animal + plants + bacteria. The slush
hypothesis predicts that many animals like these remain to be discovered,
even in the zooplankton.